aws
Cloud Account Search Engine | Hava.io
What if you could search through all of your cloud accounts with a single command. Find the resource types, ips, tags, names or ids you are looking...
Could your team show you with any confidence what systems and resources you have running in the cloud. Could they do that today, or right now.
Or would they need a few days or longer to trawl through consoles and configuration documents or possibly hunt down the original design documents that the system architect drew up when you moved to the cloud and compare that to what appears to be running at the moment.
There are a ton of reasons you would need a clear picture of exactly what you have running and sometimes you need that information in a hurry. In the event of an outage, when the support desk phone system goes into meltdown with users reporting they cannot access your systems, knowing what was running an hour ago when things were fine vs what is running now is mission critical.
Or maybe your AWS / GCP / Azure bill just landed and costs have blown out beyond all expectations and you need to find out why to either justify the spend or stem the bleeding.
Then of course you might have an annual compliance audit coming up and need to demonstrate exactly what you have running, what the security looks like and how things have changed (or not) from last year's audit.
Whatever the reason an accurate diagram that maps out your cloud infrastructure and shows you what resources or container workloads you have running and where they are running can be worth it's weight in gold.
At the start of a project people have every intention of documenting their infrastructure, sometimes they even get around to creating a diagram, but from there as changes occur, the diagrams are usually neglected especially if there are multiple cloud accounts or vendors involved, or if you have multiple projects or client networks to manage. The documentation becomes a time consuming chore that is a last priority. Most people simply hate the thought of updating diagrams.
This is the main reason why, when a catastrophe or anomaly occurs there is rarely an accurate up to date diagram available to help kick start the troubleshooting process.
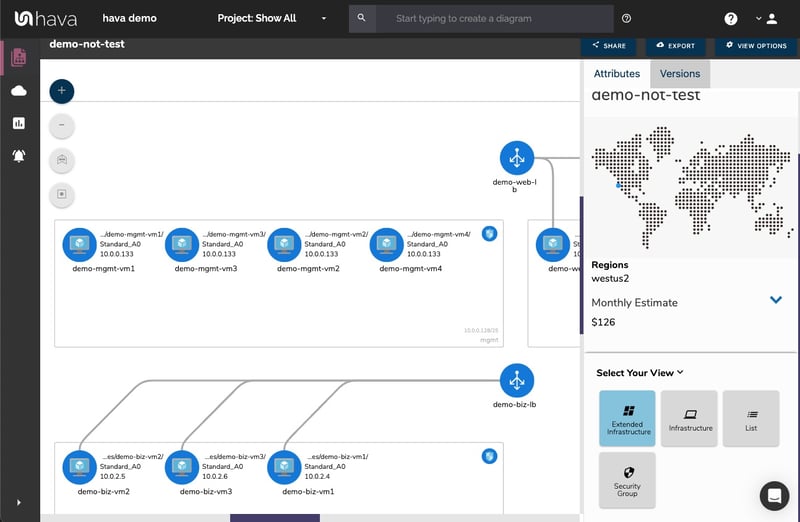
The answer of course is to automate the process of generating and updating diagrams using hava.io. By simply connecting your AWS, GCP, Azure accounts and stand alone Kubernetes clusters to Hava, the application will generate diagrams for all the virtual networks, VPCs and container clusters discovered. From there, Hava will continuously poll the connected console settings and update the diagrams when changes are detected. The update process is 100% hands free, which means you have nothing to remember or schedule, Hava takes care of things, so you have fresh up to date diagrams showing you exactly what's running where in your cloud infrastructure.
The main platforms supported are:
AWS - see all your VPCs, security group visualisations and ECS container views.
GCP - Networks
Azure - Resource Groups, Virtual Networks and Security Group visualisations
Kubernetes - See the clusters you connect as a data source to Hava.
There's no practical limit to the number of accounts you can connect to Hava. So if you are a managed service provider, developer or a consultancy with hundreds of accounts to look after, you can have all your diagrams in one place. The major benefit of this is you can see what is happening practically live and you can find things fast.
So you have a problem. Something has been flagged in an alert or log entry and you need to find the resource fast. If you have lots of accounts with lots of networks you ultimately have lots of diagrams to search through, so you still potentially have a time consuming challenge ahead to find the problem resource.
Or maybe you know the resource you want to find, but you have no idea which account it belongs to. The potential to burn hours and hours of valuable time trying to track down resources is very real.
Because you have all the accounts you manage connected to your Hava account, you can use the search and filter function to scan through all the connected cloud accounts and kube clusters to find what you are looking for with a single search.
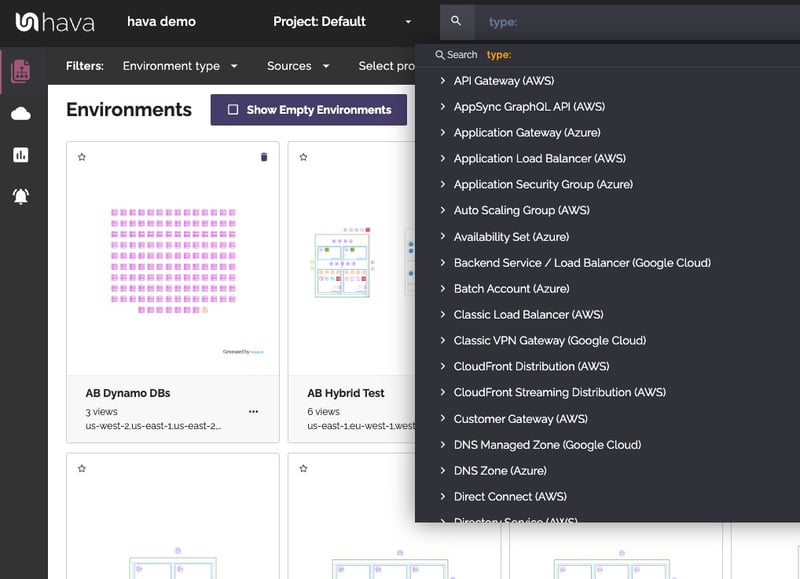
A single search to scan through hundreds of accounts or tens of thousands of resource instances has the potential to find what you are looking for in seconds or minutes instead of spending hours or even days console hopping.
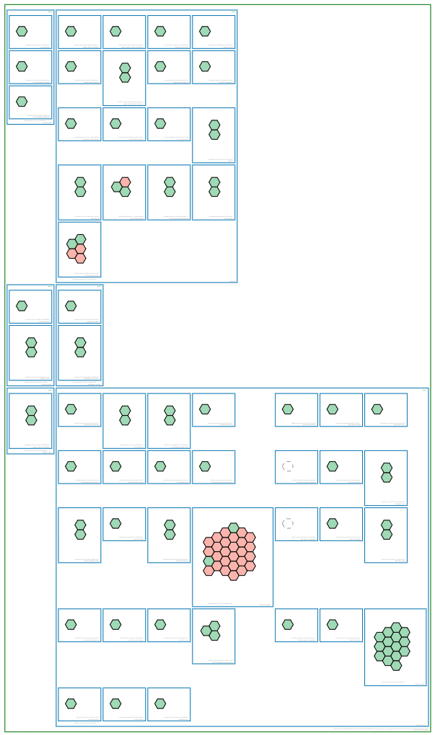
The custom search will return a diagram with the matching resources. If you are a DB admin, you could for example create one diagram with all the databases that exist in all the cloud accounts under your management. The fun doesn't stop there. You could then save that diagram to your cloud diagram dashboard and it will keep itself up to date along with the all the other auto generated diagrams, so you can go back to it over time to see what's changed.
On top of needing to know what's running where in your cloud infrastructure, you often need to know what has changed. If the Hava diagrams were just up to the minute diagrams of your network infrastructure it would be difficult to pin down changes, like the type of changes that stop users accessing your applications or make data unavailable.
To solve this problem, whenever Hava detects a change in network configuration a new diagram is generated and the superseded diagram is placed into version history.
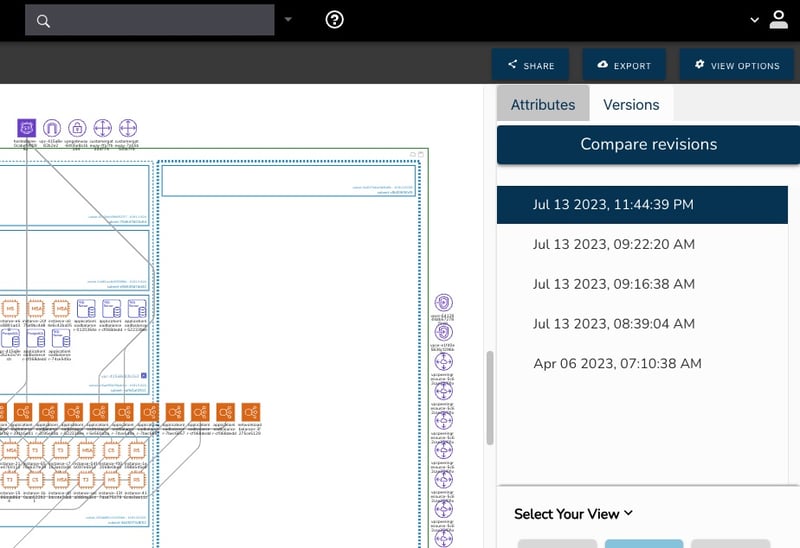
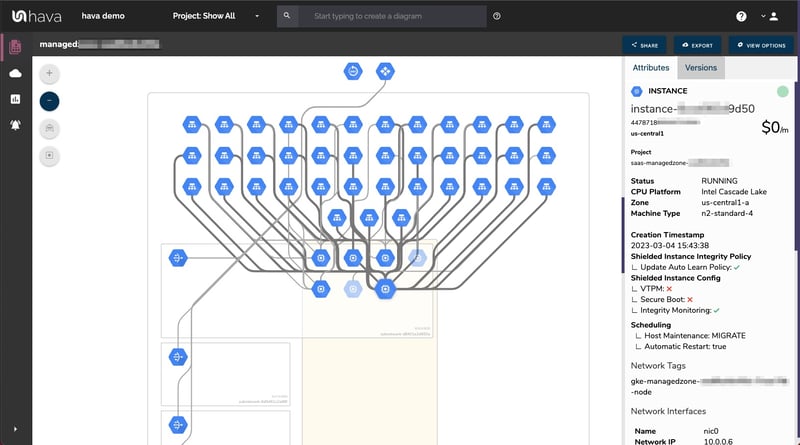
You can select a previous version of your network and view the diagram as if it was live. You can select resources and inspect the metadata and attributes of each resource.
This means you could inspect diagrams side-by-side and visually compare the two diagrams to see what is missing, or what has been added. You could also export export both diagrams in JSON format and programmatically diff the configuration to find all the differences.
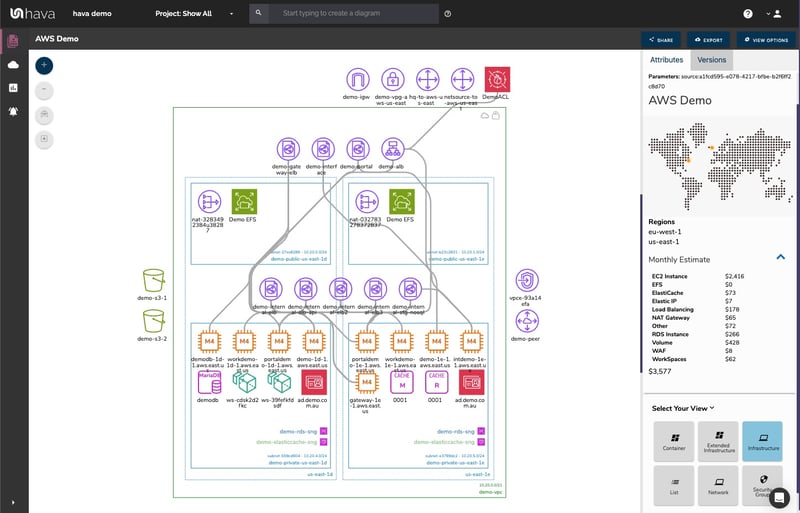
All Hava diagrams are interactive. This means you can stay on the diagram, select a resource and inspect the settings and metadata in the attribute pane to the right of the diagram:
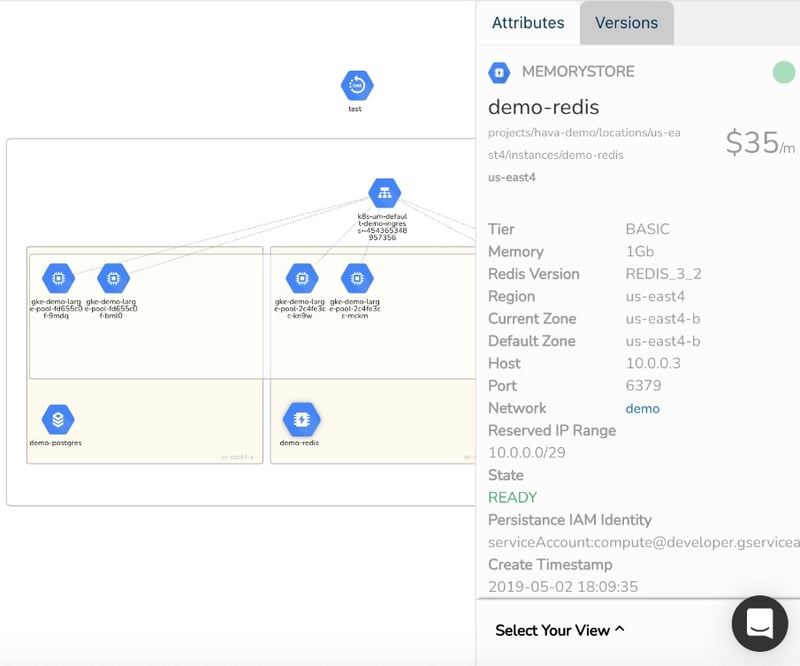
This saves a considerable amount of time logging into different cloud account consoles to find out the settings and config data you need to know. Bear in mind you could create hybrid diagrams with networks from different vendors on the same diagram, or diagrams with specific resources like databases, load balancers or firewalls from multiple accounts. All the data is collated on the diagram in front of you without the need to console hop to find out what you need to know.
So to recap, whether you are taking on a new client network, are joining a new project or just have a single application to manage, the very first question you will ask yourself in terms of cloud infrastructure is "what's running where".
By connecting your cloud accounts and Kubernetes Clusters to Hava, you will always be able to answer that question.

You can take Hava for a free 14 day trial. Learn more using the button below.

What if you could search through all of your cloud accounts with a single command. Find the resource types, ips, tags, names or ids you are looking...
Finding resources across multiple cloud accounts is time consuming especially if you manage hundreds or even thousands of client cloud accounts. Hava...
Finding AWS resources fast when you manage multiple accounts and virtual networks can be challenging. If you need to know exactly what you have...