aws
Killing Your Long Lived Development/Test Cloud Environments
Are you running dev or test cloud environments that are no longer in use? Do you have resources running that nobody is using. Connect Hava to your...
So imagine your worst nightmare. The cloud based application you have just inherited management and support for has just crashed. The support lines are lit up like a Christmas tree, the support ticket system is having a meltdown and everyone is looking at you for a solution.
The problem is, the system has been cobbled together for years with add on services and workloads, it's not entirely clear what is causing the outage. Is it your end, maybe someone pushed an infrastructure change and it's had unintended consequences, or is it a vendor outage, has an entire region just dropped out.
Either way you're going to need to find the problem network. Then to get this thing running again, you're going to need to know what the network resources looked like when everything was ok. To solve the outage quickly it would be incredibly useful to know what is missing or what has been added or changed.
Could it be an entire availability zone has disappeared, or has a firewall been changed, or maybe a database has gone offline.
You can of course start trawling through the error logs or alerts and try to associate errors with services and the impact that may have had. Is the error the cause or just a symptom.
If you need to respond fast, there is no substitute for a visual audit trail of your cloud infrastructure changes like the one provided by the versioning mechanism found in hava.io.
Every time a change is detected in your AWS, Azure, GCP infrastructure or Kubernetes clusters a new diagram of the network topology is automatically generated and the superseded diagram is moved into version history. This ensures you always have a diagram of exactly what is running now and can compare that to what was running before the change.
So if the outage was caused by a configuration change like the removal of a resource like a compute instance or database, a visual comparison of the two diagrams side by side will allow you to spot the differences straight away.
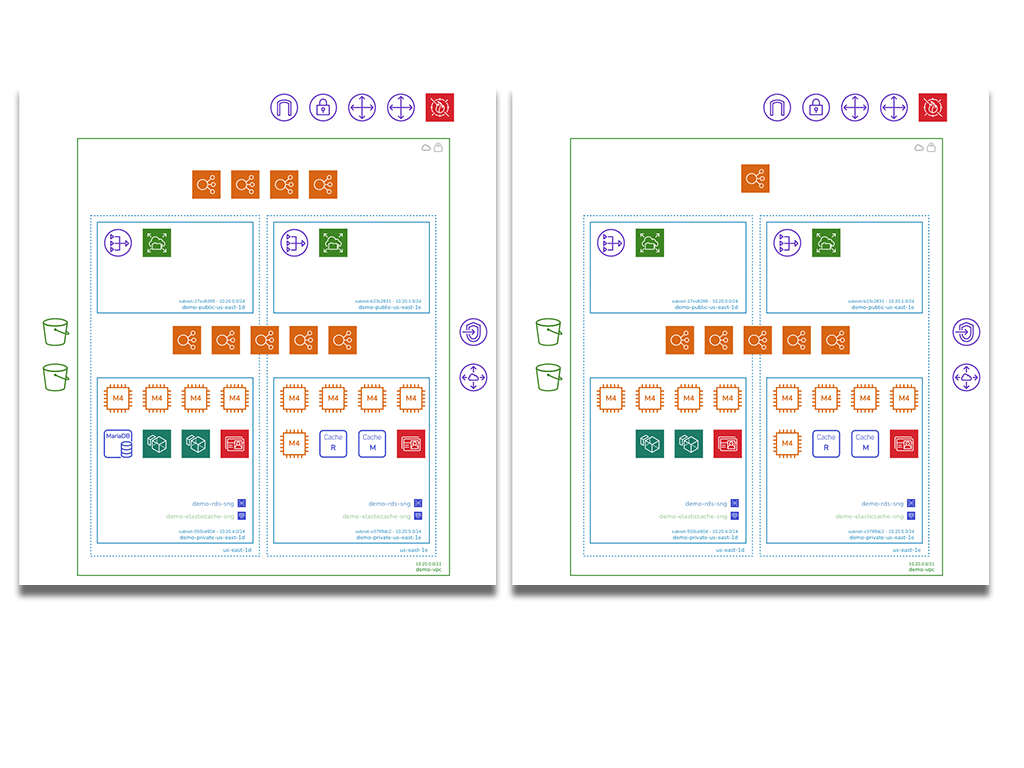
If the change was a little less obvious, like an endpoint IP address changing then exporting both diagram settings to JSON format and diffing them programmatically will give you a decent chance of identifying the root cause of the outage quickly.
In the scenario where you have multiple or maybe hundreds of cloud accounts under management that host application dependent resources like databases, storage or instances and you are in the middle of an outage, the first priority is to identify the VPC, Virtual network or container cluster that is experiencing the problem.
If you have a known resource id, name or maybe a value like an IP address or tag that you can extract from error logs or alerts, you can use Hava's search and filter function to track down all matching occurrences in any of the cloud accounts or clusters you have connected to your Hava account.
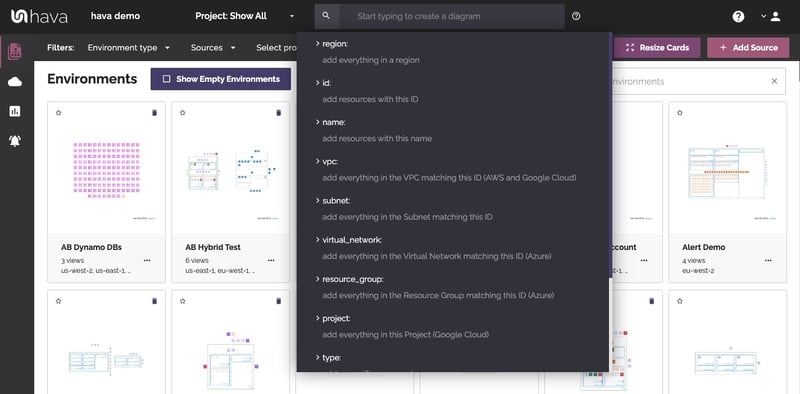
Executing a search will return a diagram with the resources matching the search term. If an IP address search found a match on an AWS load balancer for instance, the resulting diagram will bring back the load balancer, subnet and VPC. Now you have the VPC, you can execute another search on the VPC to bring back the entire virtual network, or go to the environments dashboard and find the associated diagram to use to compare previous versions to help identify the cause of the outage.
If your application is containerised the outage could be the result of a stopped pod or task, or maybe an entire node has disappeared. Either way you can use the same approach to review your ECS, AKS and Kube clusters using Hava.
An initial visual review of the current diagram will highlight any pods or tasks that are in a sub optimal state. The hexagons in an amber or red state would be the first place to start looking.
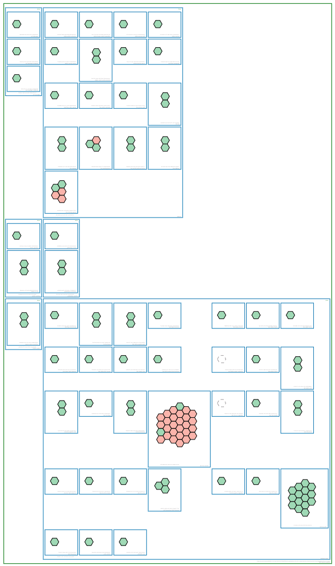
From there, you can pull up previous versions of the diagram and visually compare the diagrams, or dig into individual pods or tasks to identify the running containers.
There are any number of ways having accurate diagrams and an audit trail of changes in diagram form can help during an outage. If you are not using Hava to auto generate diagrams of your AWS, GCP, Azure environments or your stand alone Kubernetes clusters the sooner you connect and start tracking your network changes, the sooner you will be in a much stronger position should the worse happen.
Whether you are managing one cloud account, or one thousand you can leverage Hava in either SaaS or self-hosted formats to automate and track your cloud infrastructure.

You can try out Hava for free, learn more using the button below.

Are you running dev or test cloud environments that are no longer in use? Do you have resources running that nobody is using. Connect Hava to your...
If you are running Kubernetes clusters, you can now use Hava to automatically visualise your K8 clusters to instantly see the status of the nodes and...
There are so many reasons why you should automate your cloud network diagrams. These 5 are right up there, especially if you are building...