aws
Wildcard and Negative Match Cloud Resource Search
Using Hava's custom search, you can identify and diagram resources from multiple vendors and cloud accounts with a single command. Wildcard and...

According to a recent Gartner report, global cloud spend is projected to reach US$300bn by 2021.
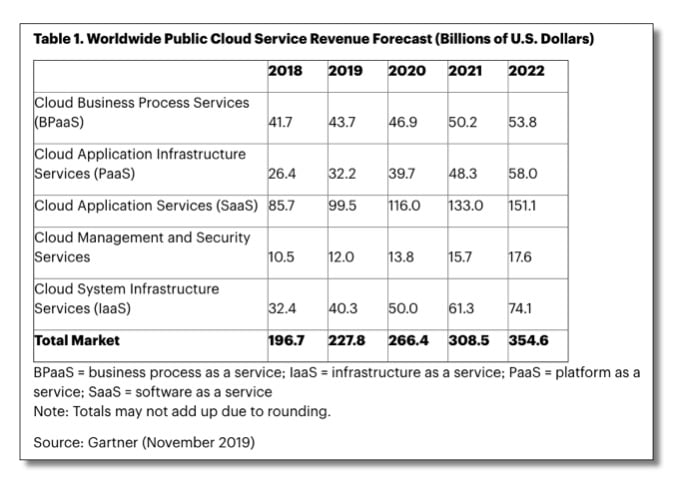
The transition away from corporate hardware and networks to cloud based IaaS has meant that companies are eliminating hard up front costs associated with server hardware in favour of spreading the costs over time.
Leveraging cloud solutions has the added benefit of not only eliminating the large up front costs associated with hardware, but also the ongoing hardware and software maintenance and inevitable replacement costs when the hardware reaches end of life or is no longer fit for purpose.
When a company heads down the cloud IaaS path, the transition IT team or consultants will have a good idea what is required in terms of cloud resources to move your applications and what the data storage requirements will be. Once those resources are defined, then an estimated cost can be calculated and presented as part of the business case to go cloud based.
As you probably know, where a project starts, isn't necessarily where it ends up, especially if you need to scale up resources due to increased demand or unforeseen issues with the initial design.
Keeping a close eye on estimated cloud costs and reporting data in an easily understandable format is not only astute business practice, but also necessary to keep your accounts team and CFO in the loop. The last thing you want to do is roll out the latest design methodology or performance strategy then wait for the knock on the door from the CFO asking why this month's cloud spend jumped 150%
Getting a granular estimate of what your cloud configuration is likely to cost can be incredibly time consuming if you don't have the right tools. This is especially true if your cloud account hosts several projects where you need to apportion costs to different cost centers.
As you may or may not know, Hava interactive cloud diagram SaaS does a whole lot more than simply map out your cloud diagrams. Cost estimation down to each individual resource is built into the software.
Once you connect hava.io to your cloud account(s) you can see at a glance what your expected cloud spend will be.
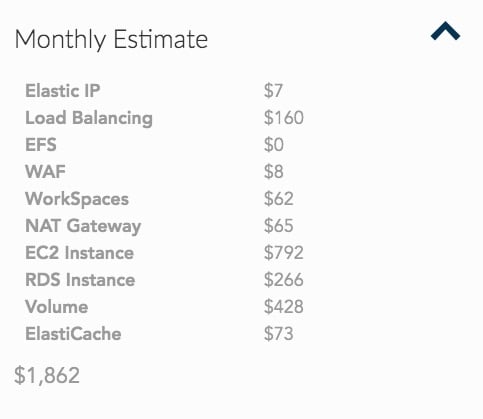
The above image is available for all environments being visualized within your Hava dashboard. It gives you a total cost estimate per resource type within the environment, which is sometimes all you need. But sometimes it's useful to dig a bit deeper.
We always describe Hava cloud diagrams as interactive because as you hover or click on resources on the diagram, the attribute pane to the side of the diagram changes to display contextual information about the resource you selected.
One of those pieces of information is the cost of that resource.
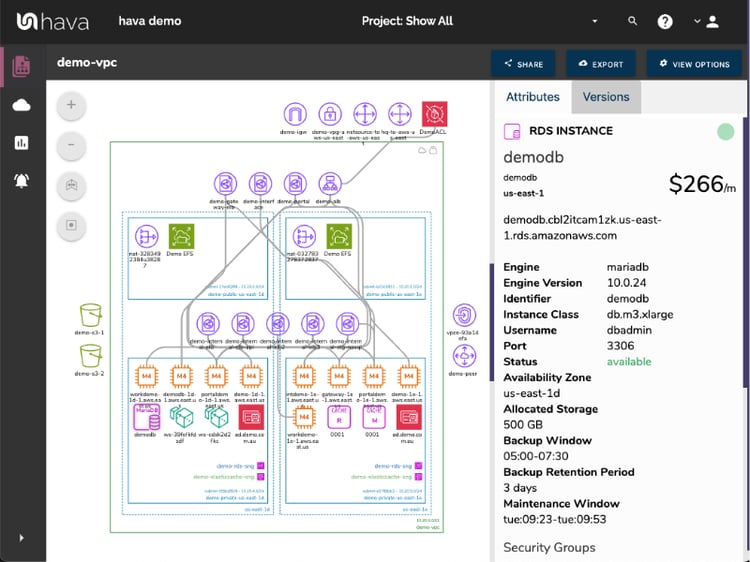
In this instance we can see this AWS diagram has an RDS instance called 'demodbl' with an estimated monthly cost of $266/m
You can click around the diagram and see the costs of all the resources individually. Cool, but not the sort of thing the CFO or accountants would appreciate having to do.
As we know, the finance department do love a nice spreadsheet. Luckily there's a simple way to avoid clicking around the Hava diagrams jotting down cost estimates and that is by utilising the "List View"
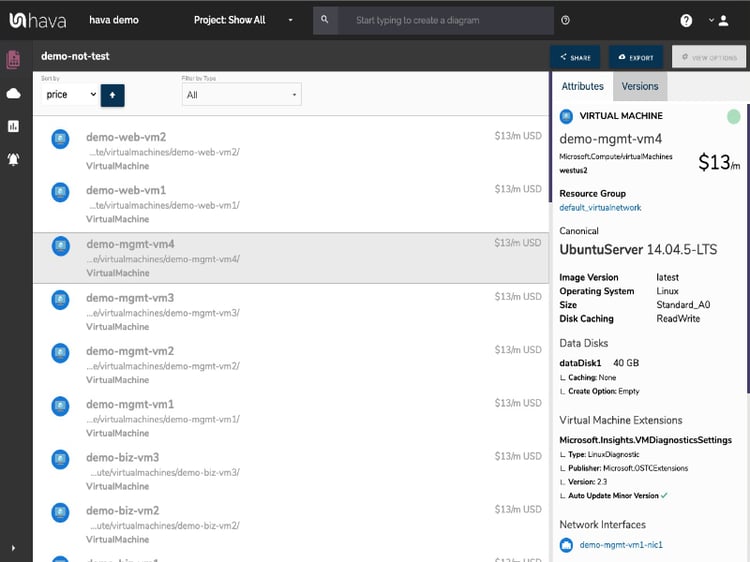
The "List View" is one of five views automatically generated when you connect your read-only AWS, GCP or Azure cloud credentials to Hava.
Where the list view differs from the other Hava diagrams is that this list contains all the resources detected in your cloud configuration, not just the ones that are visualized. This gives us a solid base to establish all the costs.
As you can see from the diagrams above, each resource is listed with the estimated cost.
To get a good idea what major resources are responsible for the bulk of your cloud spend, it's simply a matter of sorting the list by price from a drop down option box.
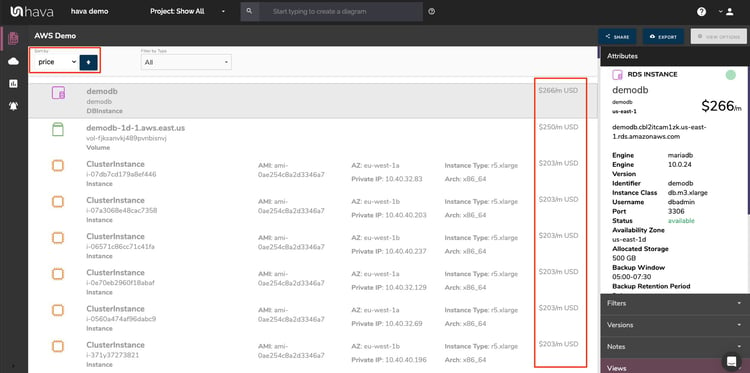
This will surface all the resources and present them by descending cost.
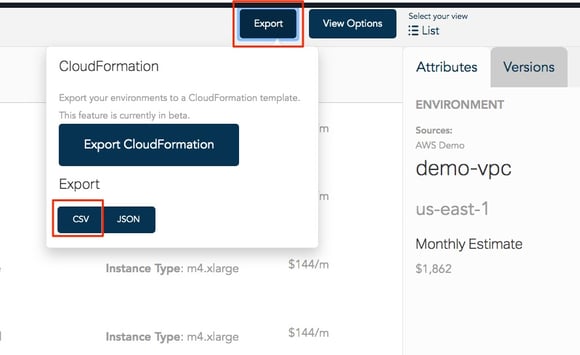
To get this data out to spreadsheet, simply take the "Export" option whilst in the "List View" and Hava will create and download a CSV file that you can open in your spreadsheet program of choice.
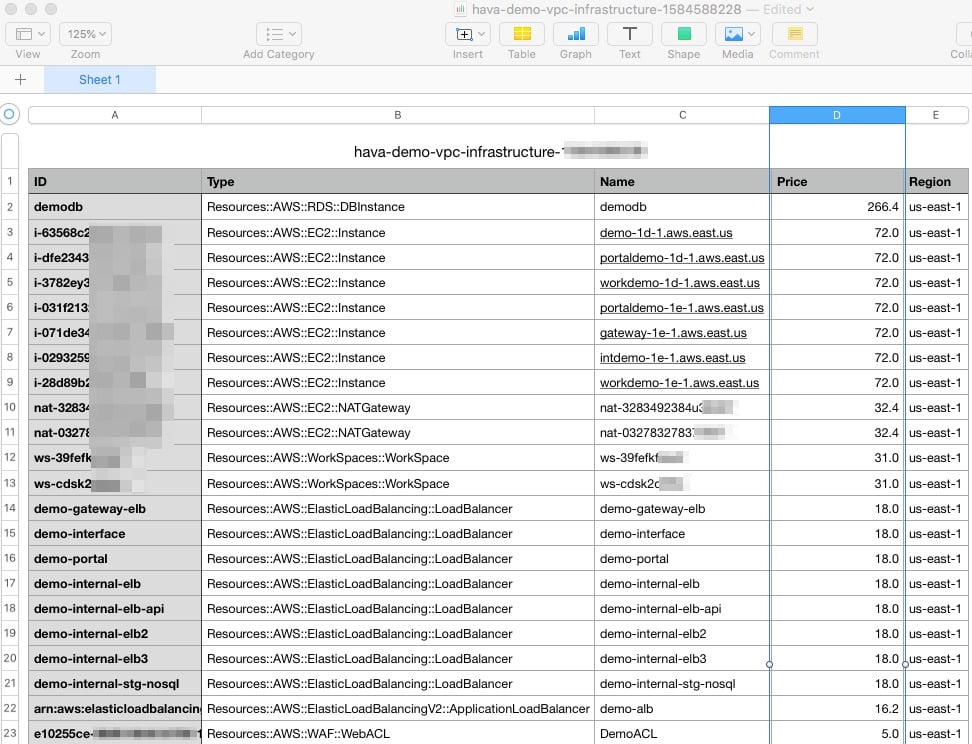
Another major advantage of viewing your resource costs this way, is that it enables you to see resources that are costing your business money but may no longer be necessary. Like old test environments or massively oversized storage or maybe even duplicated load balancers.
You can only manage what you measure and Hava gives you the tools to monitor and manage your cloud spend across all your AWS, GCP & Azure accounts.
Hava is also API driven, which means any of this data can be pulled out of Hava and repurposed for internal reporting or dashboards. It's really up to your imagination.

Hava has a free 14 day trial available - no credit card required. Why not take hava.io for a spin and see why top DevOps teams around the world consider Hava a "must have" cloud tool.

( No Credit Card Required )
Next: Hava adds elastic beanstalk, dynamo db, cloudfront visualization
Using Hava's custom search, you can identify and diagram resources from multiple vendors and cloud accounts with a single command. Wildcard and...
Active cloud architecture resources rarely end up being exactly as they were designed. How do you know exactly what resources are running now? What...
Cloud Cost monitoring is essential for keeping control of your cloud spend. Using Hava your can visualize your cloud resources and what they cost.