Hybrid cloud is a direction a lot of developers are heading down these days. Usually to take advantage of the strengths and capabilities of one particular cloud provider service.
This might be for cost or performance reasons, of for the convenience of a particular service, like the ease of use storing objects in Amazon S3 when the bulk of your application is hosted in Google Cloud.
You might also replicate services across multiple clouds to mitigate the chances of a cloud outage bringing down your entire application.
Visualizing your cloud infrastructure and resources can be difficult when you have a hybrid cloud solution. At best, your diagramming solution can visualise all the platforms you are using, only on separate diagrams, but typically they only support automation on a single cloud vendor so you have to revert to manual diagrams and console hopping to diagram your app infrastructure which is not ideal.
In this article you'll learn an easy way to combine infrastructure from multiple cloud vendors (AWS, Azure and GCP) onto a single diagram that once established, stays up to date automatically
Hybrid diagrams allow your engineers, new hires and external consultants to get a visual fix on exactly what you have running where so they can get up to speed and comprehend your network infrastructure faster. You will be able to show all levels of your organisation the security and infrastructure you have in place so any budget, compliance or security questions can be answered with confidence. This is much easier when your entire hybrid cloud infrastructure is on a single diagram.
Unfortunately most solutions fall short when it comes to producing hybrid cloud diagrams. They either don't support mutliple cloud platforms or are to complex and require manual intervention to sync and update diagrams, which usually results in outdated diagrams.
Automation is the key to producing hybrid cloud diagrams and keeping them up to date.
In this post we will cover :
What cloud providers can you automate the diagramming for?.
To automatically create a hybrid diagram, your diagram solution needs to support all the platforms you are building on. Surprisingly some name brand solutions do not.
Hava supports the three major cloud providers as well as stand alone Kubernetes.
AWS :
Azure :
GCP :
K8S :
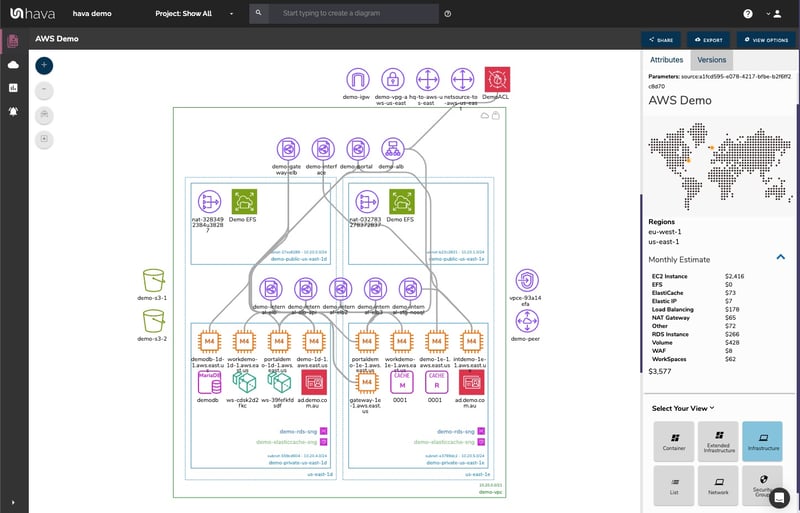
With these diagrams automatically generated and updated when you connect to the respective data source, you are then in a position to pull them into a hybrid diagram.
Hava diagrams are fully interactive, which means clicking on a resource icon will change the attribute panel to the side of the diagram to show you all the known metadata related to the resource. This saves hours of time flipping between diagram and consoles looking for that data.
Never manually create hybrid cloud diagrams again.
When you leverage automation to create your cloud infrastructure and security diagrams you free yourself from hours or days of tedious manual labour.
Provided you select the right solution, you also free up your time you would normally spend keeping those diagrams up to date.
In terms of applications and solutions built on multiple cloud platforms, the administration overheads to keep documentation up to date just compounds if you are doing it manually.
If your diagramming solution requires you to log in and manually invoke a sync to check for updates, the onus is back on you and your time to keep everything up to date.
The beauty of Hava is all this is automated. Every VPC or virtual network across all your supported cloud providers is continually scanned on auto-pilot so you don't have to.
All you need to do is connect a cloud account once and Hava takes care of the rest. This applies to a single dev with one AWS account to an enterprise MSP with tens of thousands of cloud accounts under management. Connect once and it's all taken care of hands-free.
How to create a hybrid cloud diagram that stays up to date
Because there is no easily detectable link between resources or virtual networks set up in different cloud providers, you can tell Hava which networks are associated and make up your hybrid cloud configuration.
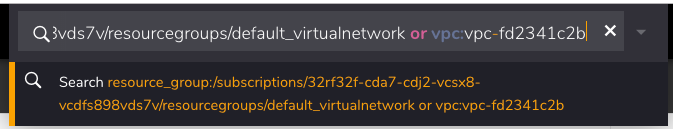
The search/query feature of Hava allows you to create custom diagrams by collating the resources or networks you specify.
You can filter down to one specific type of resource, like databases and generate a diagram with just those resources shown. You can also specify VPC or virtual network ids.
For the purposes of this hybrid diagram conversation, this is the method you can use to pull in two or more VPCs onto a single diagram, no matter what supported cloud provider they are hosted on:
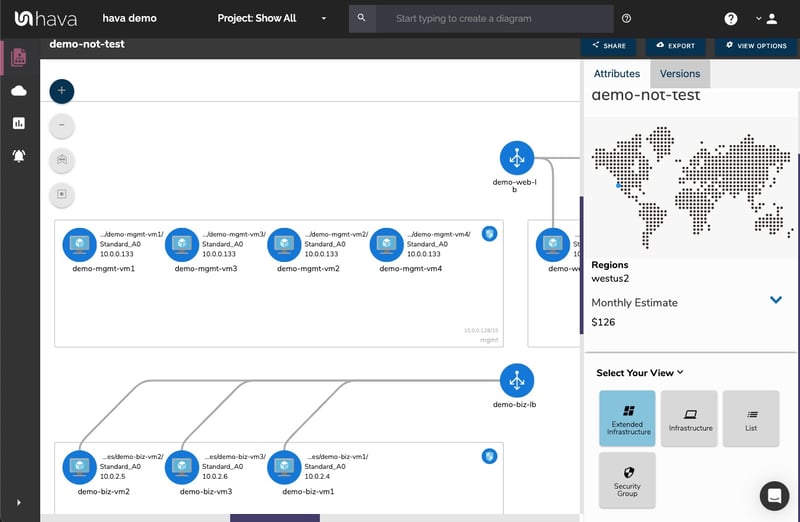
The results of such a search is an on-the-fly diagram containing and Azure resource group and an AWS VPC.
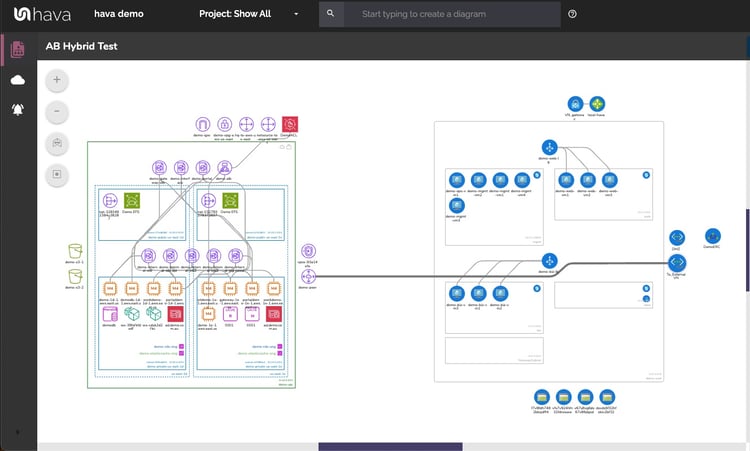
Don't worry though, you do not have to perform the query every time. As you will notice in the header bar of the above example hybrid diagram, you have the option to save the diagram.
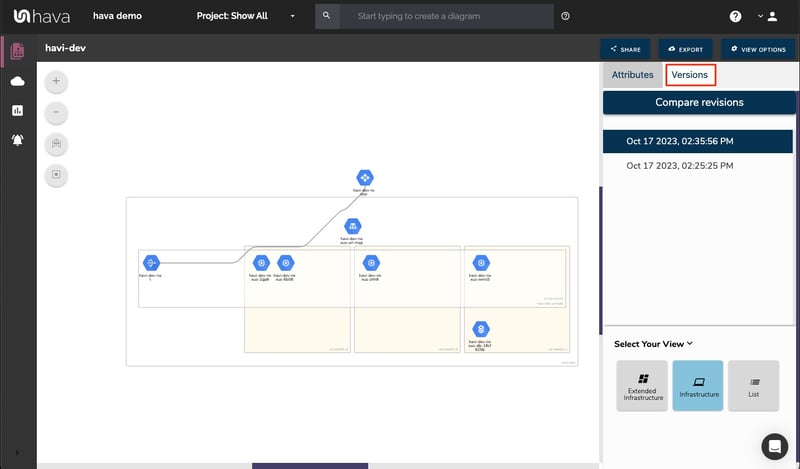
Once you save it, Hava will place it on your environments dashboard and keep it up to date. As changes in the environments that make up the diagram are detected, the individual environment diagrams are updated, but so too is the saved hybrid diagram.
Superseded diagrams in both the source and hybrid diagrams are placed in version history so you have an audit trail of changes and a place to go looking should you experience unexpected network or application behaviour. Sometimes this helps pinpoint changes in seconds that may otherwise be difficult to isolate in the consoles and logs.
The hybrid diagrams stay on your environments dashboard and will continue to update until you choose to remove them by deleting the diagram.
This on-the-fly diagram creation method can also be used to narrow in on just the data you are interested in, be that a particular subnet, IP range or a particular resource type. Say you are a DB admin, you can create a single diagram with the databases from the VPCs you are responsible for. These could be from hundreds of data source accounts hosted on multiple cloud vendor accounts.
If you do have hundreds or thousands of cloud accounts under management, you can use the Hava search to locate assets from all of your connected accounts with a single search query. There's no need to log into a single console. Imagine what time that saves.
Now you have your hybrid cloud diagram, what can you do with it?
You can do all the things you can with a standard auto generated Hava diagram.
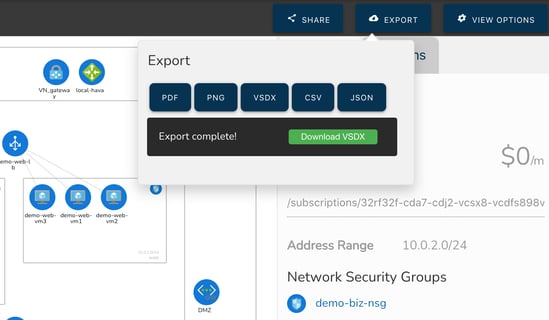
You can export image files in PDF and PNG formats for inclusion in reports or presentations, or to store offline or in doco repos.
You can export to VDSX format. This allows you to pass the diagram to Visio or draw.io to then edit the components and make planning or redesign annotation.
You can also export the data that makes up the diagram in CSV or JSON format for programmatic purposes. You may want to export the live diagram along side a previous version in JSON to run a diff across the 2 files to identify changes.
You can also use the Hava embedded viewer to place fully interactive diagrams in external web properties that support iFrames.
On top of that the Hava developed integrations like the Confluence plug in allow you to easily place live diagrams into your Wiki. The Github action allows you to generate and store diagrams within your Github repo as part of your CI/CD pipeline as does the newly developed Terraform provider.
Hava is a powerful diagramming, search and architecture monitoring tool which is in a league of it's own when it comes to hybrid cloud deployments.
If you haven't yet, you can check it out for free here:
