aws
How to Reduce Drawing Cloud Diagrams from Days / Weeks to Minutes
The way to avoid days, weeks or even months of work mapping out cloud infrastructure is to automate. Hava automatically maps out your AWS, Azure or...
As cloud technology advances, engineers are tasked with managing increasingly complex infrastructure. One of the most time-consuming tasks is creating and updating infrastructure diagrams.
This can take up valuable time you probably can't spare, that could be better spent on more critical tasks.
So we're not proposing that you do not create or maintain your cloud network documentation, what we are proposing is that you don't do it yourself.
There are so many reasons to create and maintain accurate cloud doco.
You know that already.
But as a reminder, decent up to date infrastructure and security diagrams provide the following:
Better Understanding: Diagrams provide a visual representation of your cloud infrastructure, which can help you and your team to understand the relationships between different components and how they work together. Especially useful when you take on new client cloud accounts.
Easier Communication: Diagrams can make it easier to communicate complex ideas about your cloud infrastructure to non-technical stakeholders, new engineers, external consultants or other teams you bring in for project work.
Improved Collaboration: By providing a clear picture of your cloud infrastructure, diagrams can facilitate collaboration between teams, helping to ensure that everyone is working towards the same goals and understands the impact of network changes.
Faster Troubleshooting: Diagrams can help you to quickly identify the source of any issues that arise in your cloud infrastructure, allowing you to resolve them more quickly and reduce downtime. Hava's versioning always has pre and post change diagrams on hand so you can pinpoint the source of unexpected issues.
Efficient Planning: Diagrams can help you to plan changes or upgrades to your cloud infrastructure more efficiently, allowing you to identify potential issues before they occur. Your architects have a clear line of sight to what is running now prior to starting redesign work.
Better Documentation: Hava diagrams can be a useful addition to your documentation, helping to ensure that everyone has a clear understanding of your cloud infrastructure and how it works as well as the security stance of your AWS and Azure environments.
Risk Management: Diagrams can help you to identify potential security risks in your cloud infrastructure and take steps to mitigate them. With clear well laid out diagrams, you can visually appreciate the impact of a zone outage or an un-replicated resource failing.
Compliance: Diagrams can be used to demonstrate compliance with regulations or industry standards, which can be important and often mandatory in certain industries.
Capacity Planning: Diagrams can help you to plan for future capacity needs, allowing you to ensure that your cloud infrastructure can handle increasing demand.
Cost Optimization: By providing a clear picture of your cloud infrastructure, Hava diagrams can help you to identify areas where you can reduce costs without sacrificing performance.
So yes, create diagrams and yes, keep them updated, but don't spend a minute manually diagramming or updating them. There is a better way.
Use automation.
Hava.io offers a solution that can do this job for you, freeing up you, your engineers and architects to focus on more important work.
Why are cloud diagrams so important?
It's an important issue worth repeating. Cloud diagrams are essential for understanding the relationship between different components of a cloud infrastructure. These diagrams provide a visual representation of your cloud infrastructure and helps your engineers to identify any issues early as well as help them to optimize performance.
Without these diagrams, engineers, ops, external consultants and dev teams may struggle to understand the complexity of the infrastructure, leading to errors, unexpected downtime and other issues that could impact your business.
Why are cloud diagrams so time-consuming?
Creating and updating cloud diagrams manually is a time-consuming task. Engineers must manually add and update every component of the infrastructure, which can be a daunting and tedious task using a cloud console and a drawing package.
Any change in the infrastructure requires an update to the diagram, which can be a significant burden on engineers' time. Additionally, as cloud infrastructures become more complex, the time required to create and update diagrams increases exponentially.
If you run a large complex cloud infrastructure, multiple cloud accounts across different vendors or have dozens or client networks under management, the task of keeping documentation up to date can be expensive or near impossible.
Hava.io is an automated platform that generates cloud infrastructure diagrams automatically. With Hava.io, engineers can create accurate and up-to-date diagrams quickly and easily, without spending hours manually updating them. The platform is compatible with a variety of cloud providers, including Amazon Web Services, Google Cloud Platform, and Microsoft Azure.
When changes are made to previously diagrammed cloud infrastructure, Hava.io automatically detects the changes and updates the diagram accordingly. This means that engineers can spend their time on more important tasks, such as optimizing performance and identifying potential security threats.
Benefits of automating cloud diagrams.
The benefits of automating cloud diagrams are clear. With Hava.io, engineers can save time, increase accuracy, and reduce the risk of downtime. Additionally, the automated nature of the platform ensures that diagrams are always up-to-date, reducing the risk of errors or inconsistencies.
We firmly maintain that updating cloud diagrams manually is a waste of time. With the increasing complexity of cloud infrastructure, engineers need a better way to manage them. Hava.io offers an automated solution that can save engineers valuable time and provide the clarity to help reduce the risk of downtime.
By automating the process of creating and updating cloud diagrams, engineers can focus on more important tasks, leading to better network performance, fewer errors and greater efficiency all round.
Hava allows you to connect your AWS, GCP and Azure cloud accounts, or stand alone Kubernetes clusters to Hava and the application auto generates a number of diagrams for each VPC, virtual network or container cluster discovered.
The diagrams are fully interactive.
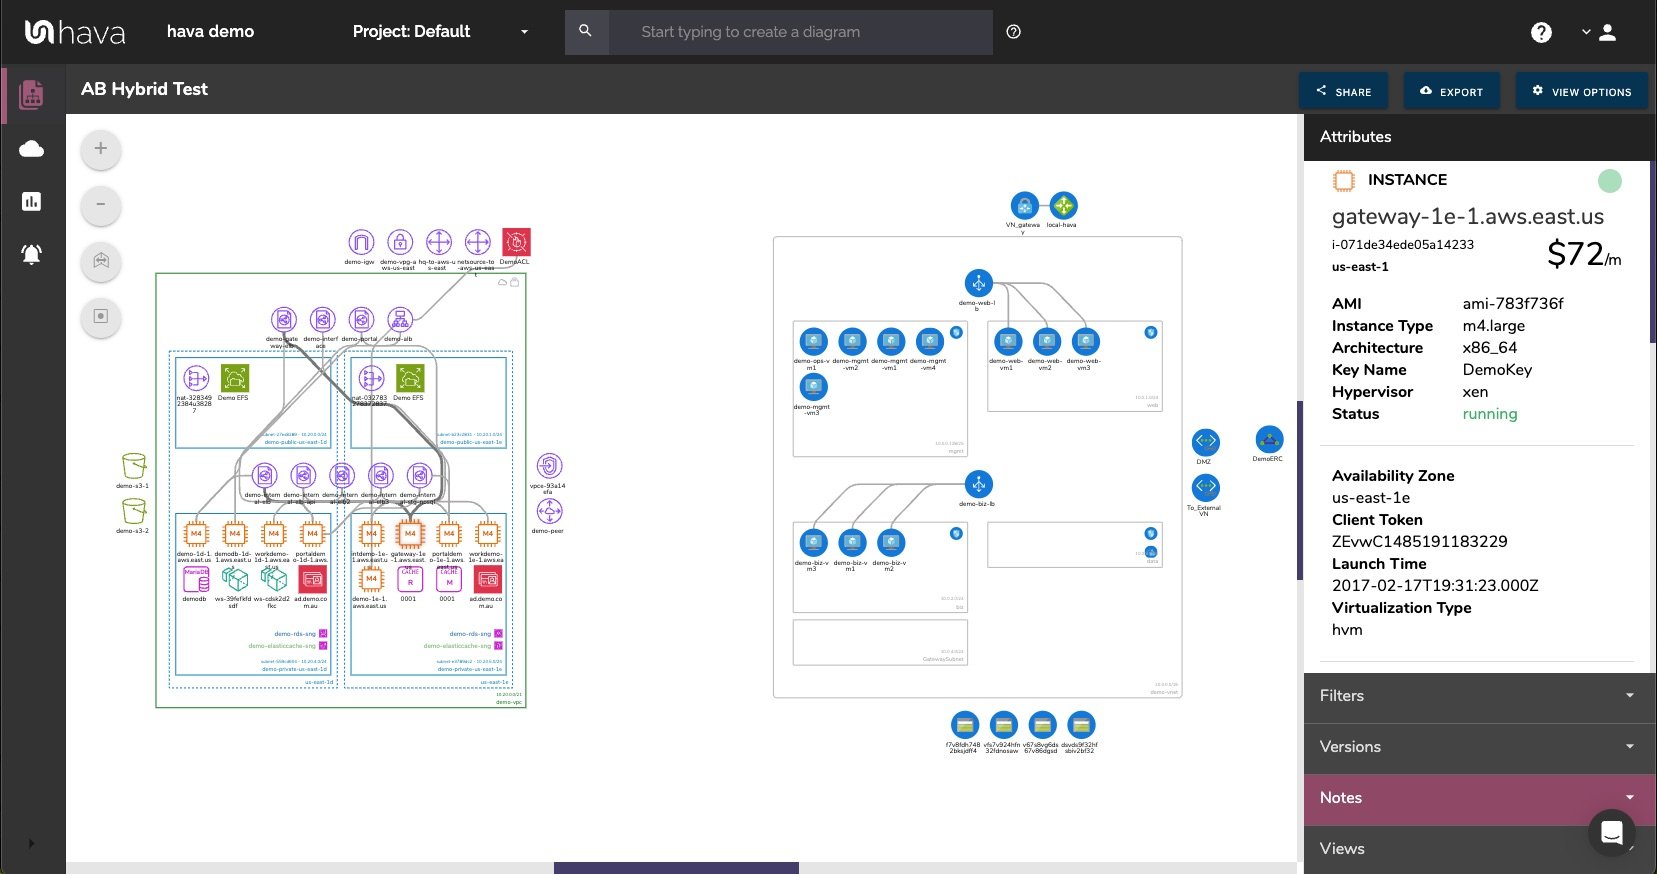
When you select a resource, subnet, AZ or other grouping, there is an attribute panel to the right of the diagram which shows you all the known attributes, settings and metadata related to the selected resource (including a cost estimate). This data isn't displayed directly on the diagram canvas as it would make the diagram messy and unreadable.
The first diagram is the infrastructure diagram. Each cloud account connected to Hava will produce a diagram set per VPC. There are no limits to the number of VPCs you can diagram in a single data source (cloud account) and you can connect as many data sources as you need (plan permitting)
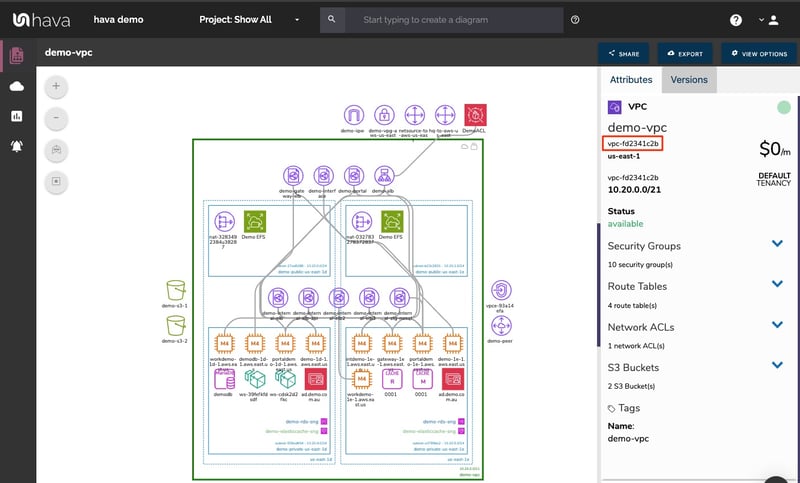
The above AWS diagram is laid out by availability zone (dotted columns) contained within the VPC (green rectangle) and shows each subnet configured (blue rectangles). Selecting a resource, in this example an elastic load balancer, changes the attribute pane to show details related to the ELB and reveals the connections from that ELB to two EC2 instances.
So you can visually see exactly what is running in this VPC and interrogate the resource settings without having to log into your AWS console, which can save you a lot of time if you are flipping between client networks.
While all the major resources are visualised on the infrastructure diagram, things like network interfaces, ACLs and storage volumes are not displayed as they can overwhelm the diagram. However, you might need to know about these second tier resources so Hava also generates a List View.
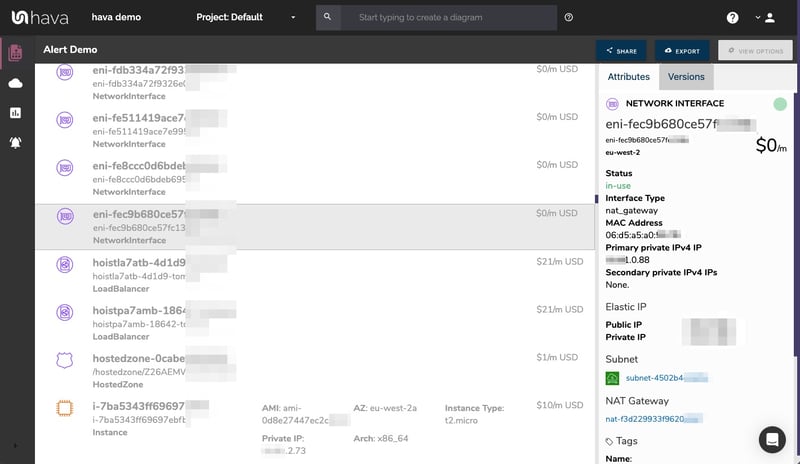
The list view displays estimated costs for each resource and is interactive. You can also sort the list and export to CSV for cost analysis or business intelligence purposes.
The next view is unique to Hava and is likely to make your security team's year.
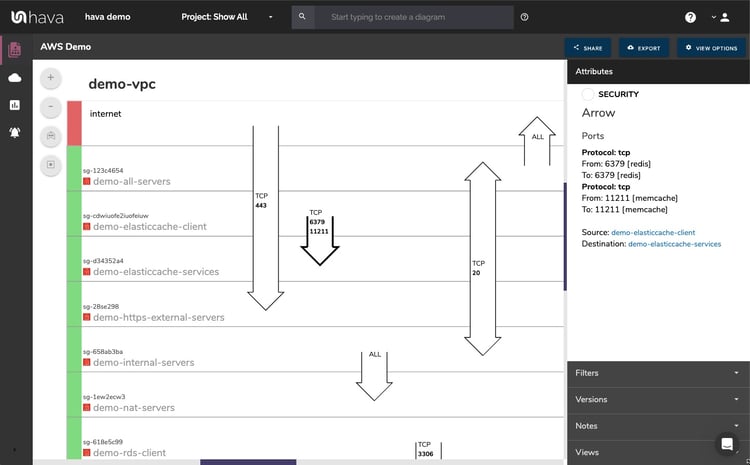
The security view available for AWS (shown above) and Azure visualises your security configuration. All the security groups are shows and are interactive. So you can select an SG and see the ports, ingress, egress and connected resources.
Overlaid on the diagram are arrows representing the open ports and protocols showing your security team at a glance what ports are open, what security groups control them and how traffic enters and exits your virtual network.
This visual at-a-glance representation of your network security posture surfaces potential problems that your security team can spot from a mile away.
Container are also visualised on separate diagrams. Whether that's cloud native ECS, EKS or AKS container workloads or stand alone K8s clusters, Hava will visualise the workloads.
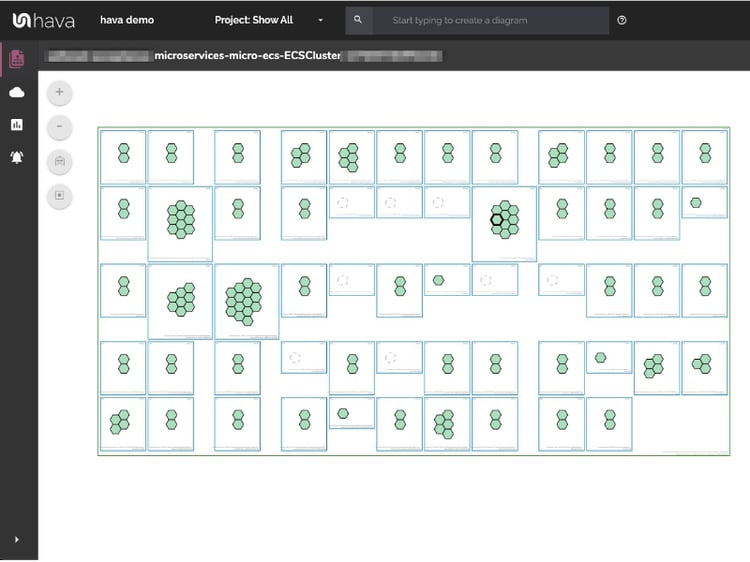
In this ECS Cluster example, the bounding green rectangle represents the ECS Cluster. Each blue rectangle is an ECS Service and the hexagons are ECS tasks.
At a glance you can assess the health of each task, whether it is running, stopping or starting, or stopped when it shouldn't be.
Hava supports ECS, EKS, AKS and GKE and also stand alone Kubernetes clusters.
Hava continuously scans your AWS architecture and when changes are detected a new diagram set is automatically generated. The superseded diagrams are not discarded or overwritten. Instead they are moved into version history. Still fully interactive.
What this means is you can view your cloud architecture at any point in time and also leverage Hava's revision comparison (Diff Diagrams) to quickly identify what has been added or removed between the two diagram dates.

So you can easily identify all the changes made since your last compliance audit, or see what changed yesterday that is causing unexpected network or application errors.
While diff diagrams are super helpful in diagnosing changes after the fact, you may want to keep on top of changes as they happen.
Hava's architecture monitoring alerts will let you know the minute a change is detected. You simply nominate the environment you wish to monitor and add a group of recipients to receive the alerts. When a change is detected like the addition or removal of a resource, Hava will send each recipient a diff diagram showing the changes.

Now you and your security team can be across every change as it happens so you can assess and take action if required.
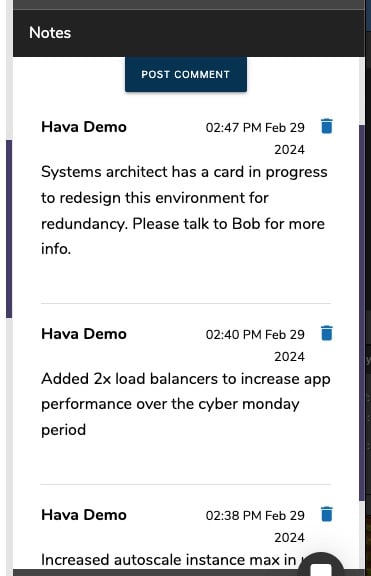
For every architecture diagram generated you have the ability to add text comments. This serves as a rolling dialogue your team can contribute to that may better explain elements of the diagram or bigger picture concepts related to the diagram.
Notes are accessed from the accordion menu within the attribute pane.
New notes are added to the top of the list so they are stored in chronological order.
Hava is a web app that can be used over the internet on a SaaS basis. Once you sign up, you can log in, connect your cloud accounts and let Hava work its magic. Nothing to deploy or maintain, it's all taken care of.
However, some enterprise clients have strict governance or security policies that prevent them connecting to Hava SaaS. In these circumstances you have the option of self-hosted.
You can deploy Hava on your own infrastructure, behind your own security which solves the majority of compliance issues. The self-hosted option is a little more complex as you would imagine, but we have engineers and partners available to ensure your self-hosted deployment is a successful and smooth process.
As engineers we appreciate the desire to script and integrate as much as possible in your ci/cd or deployment pipeline. We are constantly building integrations to make that easier.
Currently you can leverage integrations with GitHub and Terraform on the deployment side, and an Atlassian Confluence plug in to take live interactive Hava diagrams into your Wiki.

Also Hava's embedded viewer allows you to take interactive diagrams, restricted diagrams and static diagrams and place them anywhere that supports iFrames.
In conclusion, Hava's automated cloud infrastructure diagrams provide a clear and concise view of your cloud environment, helping to simplify the process of managing and monitoring your infrastructure.
By eliminating manual processes and providing real-time visibility into your architecture, you can focus on more critical tasks and make informed decisions about your infrastructure. Adopting automated cloud diagrams is a smart choice for any cloud engineer looking to streamline their architecture management and monitoring processes.

You can take the Hava Teams plan for a completely free 14 day trial, connect your cloud account and get instant visibility across all your VPCs and virtual networks.
Use this button to learn more:

The way to avoid days, weeks or even months of work mapping out cloud infrastructure is to automate. Hava automatically maps out your AWS, Azure or...
How many ways can a simple security view diagram help enhance your cloud security? In this post we take a look.
There are a lot of capabilities cloud executives can leverage when they adopt Hava. Greater clarity, the ability to track and analyse changes over...