aws
How Cloud Executives Can Improve Decision Making Using Hava
There are a lot of capabilities cloud executives can leverage when they adopt Hava. Greater clarity, the ability to track and analyse changes over...

As a cloud engineer, you understand the complexities and challenges of managing and monitoring cloud environments. The ever-evolving nature of cloud infrastructure requires frequent updates, changes, and modifications which comes with plenty of challenges.
It can be difficult to keep track of all the components, configurations, and interconnections of your cloud infrastructure. Diagrams are a huge asset to your organization, but also a huge burden to produce. It’s even more tedious to monitor your infrastructure and keep your network doco up to date than it is to sit down and produce the diagrams in the first place.
Cloud infrastructure diagrams are becoming increasingly important in today's rapidly evolving cloud computing environment. They provide an effective way for cloud engineers, architects, and security teams to keep track of their cloud environment, reduce manual work, and ensure that their cloud environment is secure, cost-effective, and compliant.
Everybody knows the benefits of accurate and up to date infrastructure diagrams but sadly they usually don’t have the time, people or budget to produce decent diagrams and keep them updated.
But what if there was a solution that could simplify the process and provide real-time visibility into your cloud architecture? That solution is automation.
In this post you’ll learn:
Why Trawl Through AWS, GCP or Azure Consoles When You Can Have a Diagram?
Manually navigating through your consoles to understand the architecture of your cloud environment can be time-consuming and error-prone. With automated cloud diagrams, you have a single, up-to-date view of your entire infrastructure, including all components, configurations, and interconnections. This makes it much easier to understand your infrastructure and quickly identify any potential issues, vulnerabilities or areas for optimization.
Say Goodbye to Manual White Board Diagrams
Traditionally, cloud engineers and architects have had to manually create white board diagrams or draw them using tools like draw.io to understand or communicate the architecture of their cloud environment. But with automated cloud diagrams, the diagrams are created automatically and kept up-to-date, freeing up your time and resources to focus on more critical tasks.
Interactive Diagrams in Github and Your Wiki
Automated cloud diagrams can be integrated into Github and/or your Wiki, providing real-time visibility into your architecture, and helping to improve collaboration and communication. The diagrams can also be made interactive, allowing for easy navigation and exploration of the infrastructure by team members who may not have access to the diagram application.
Multi-Cloud Deployments Made Easy
In a multi-cloud deployment, it can be challenging to understand the architecture of your application. There is nothing worse than having to flip between different cloud accounts to try and interpret what you have running. With automated cloud diagrams that support multiple vendors, you finally have a clear and concise view of your entire infrastructure on a single diagram.
Link to the Cloud Inventory in Visual Context
Automated cloud diagrams can be linked from your Configuration Management Database (CMDB), providing a visual representation of where each component fits into the architecture. This provides context and makes it easier to understand the impact of changes to your infrastructure and quickly identify any potential issues.
Tracking Changes Over Time
Diagrams with versioning are also useful in tracking changes in the cloud environment over time. They provide a clear picture of the difference between last year's and this year's ISO/PCI/SOC audit, enabling cloud engineers to keep track of changes in their environment as they occur. The diagrams also make it easier for cloud engineers to produce a report outlining their cloud security posture, which can be sent to the security team to help them understand how the cloud hangs together.
Should disaster hit, having an audit trail of changes in diagram form can help you to quickly identify changes or missing resources that might be the cause of the problem.
Help for MSPs and Professional Services Teams to understand client cloud infrastructure
For those managing multiple cloud clients, automated diagrams provide an easy way to get a quick look at the latest version of a client's infrastructure, reducing the time and effort needed to troubleshoot issues. They also make it easier for cloud engineers to search and group resources and costs based on different meta-data (e.g. tags) across multiple cloud providers.
Improved Client Communication
Finally, automated diagrams also provide a way for cloud engineers to demonstrate to clients that they are on top of things, by providing them with a visual representation of their cloud environment. This not only helps to build trust between cloud engineers and their clients, but it also enables clients to better understand what systems are running and where, which can help to reduce confusion, build trust and explain what makes up their cloud spend.
Identifying Cost Savings
The beauty of automation is that you get to see everything that is running, including resources you might not know about. It's not uncommon for new Hava clients to uncover outlier resources, duplicates or historical snapshots or entire obsolete dev/test environments that are no longer needed but are still running. Switching these off can deliver immediate and sometimes substantial cost savings,
When you visualise your infrastructure you can spot potential cost savings for further investigation, like minimum resource counts on auto scaling groups being higher than needed, over specced compute instances or structural design issues utilising more resources than are really necessary.
Conversely, you might also spot design issues leaving your application vulnerable to cloud outages, like resources all running in a single AZ.
The advantages of visualizing your cloud infrastructure are endless.
Engineers that have adopted hava.io as their automated diagramming solution have all the above challenges covered, automatically, hands free.
By connecting a cloud account to Hava, you immediately get a set of infrastructure and security diagrams generated for every VPC or virtual network configured in the connected cloud account.
Once you generate your diagrams they stay updated automatically.
If you have 200 VPCs set up in a single AWS account, you'll get 200 diagram sets showing the infrastructure, resources and security posture. All the information you need to quickly understand what your infrastructure, or your client's environments look like, what resources are deployed and how they are accessed is at your fingertips.
Hava allows you to connect your AWS, GCP and Azure cloud accounts, or stand alone Kubernetes clusters and the application auto generates a number of diagrams for each VPC, virtual network or container cluster discovered.
The diagrams are fully interactive.
When you select a resource, subnet, AZ or other grouping, there is an attribute panel to the right of the diagram which shows you all the known attributes, settings and metadata related to the selected resource (including a cost estimate). This data isn't displayed directly on the diagram canvas as it would make the diagram messy and unreadable.
The first diagram is the infrastructure diagram. Each cloud account connected to Hava will produce a diagram set per VPC. There are no limits to the number of VPCs you can diagram in a single data source (cloud account) and you can connect as many data sources as you need (plan permitting)
The Infrastructure diagram.

The above AWS diagram is laid out by availability zone (dotted columns) contained within the VPC (green rectangle) and shows each subnet configured (blue rectangles). Selecting a resource, in this example an elastic load balancer, changes the attribute pane to show details related to the ELB and reveals the connections from that ELB to two EC2 instances.
So you can visually see exactly what is running in this VPC and interrogate the resource settings without having to log into your AWS console, which can save you a lot of time if you are flipping between client networks.
While all the major resources are visualised on the infrastructure diagram, things like network interfaces, ACLs and storage volumes are not displayed as they can overwhelm the diagram. However, you might need to know about these second tier resources so Hava also generates a List View.
The list view.

The list view displays estimated costs for each resource and is interactive. You can also sort the list and export to CSV for cost analysis or business intelligence purposes.
The next view is unique to Hava and is likely to make your security team's year.
The security view.
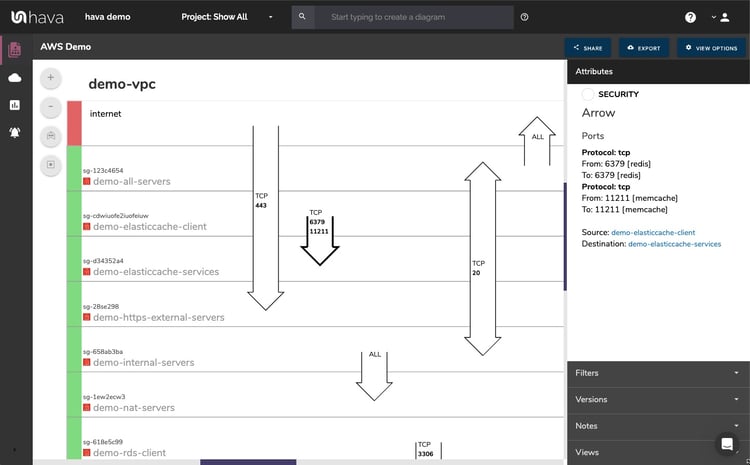
The security view available for AWS (shown above) and Azure visualises your security configuration. All the security groups are shows and are interactive. So you can select an SG and see the ports, ingress, egress and connected resources.
Overlaid on the diagram are arrows representing the open ports and protocols showing your security team at a glance what ports are open, what security groups control them and how traffic enters and exits your virtual network.
This visual at-a-glance representation of your network security posture surfaces potential problems that your security team can spot from a mile away.
Container are also visualised on separate diagrams. Whether that's cloud native ECS, EKS or AKS container workloads or stand alone K8s clusters, Hava will visualise the workloads.
The container view.
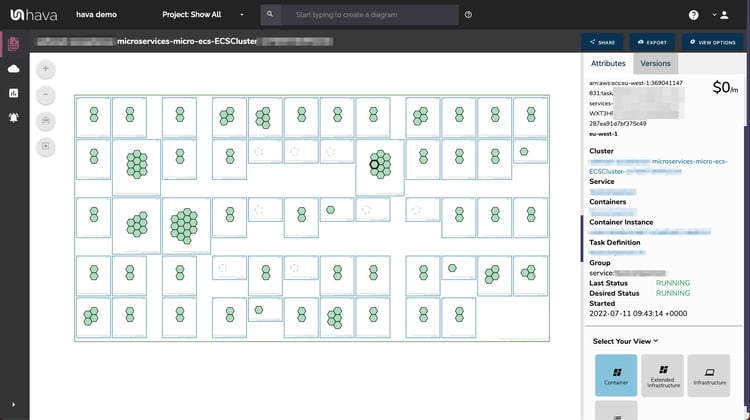
In this ECS Cluster example, the bounding green rectangle represents the ECS Cluster. Each blue rectangle is an ECS Service and the hexagons are ECS tasks.
At a glance you can assess the health of each task, whether it is running, stopping or starting, or stopped when it shouldn't be.
Hava supports ECS, EKS, AKS and GKE and also stand alone Kubernetes clusters.
Hava continuously scans your cloud architecture and when changes are detected a new diagram set is automatically generated. The superseded diagrams are not discarded or overwritten. Instead they are moved into version history. Still fully interactive.
What this means is you can view your cloud architecture at any point in time and also leverage Hava's revision comparison (Diff Diagrams) to quickly identify what has been added or removed between the two diagram dates.

So you can easily identify all the changes made since your last compliance audit, or see what changed yesterday that is causing unexpected network or application errors.
While diff diagrams are super helpful in diagnosing changes after the fact, you may want to keep on top of changes as they happen.
Hava's architecture monitoring alerts will let you know the minute a change is detected. You simply nominate the environment you wish to monitor and add a group of recipients to receive the alerts. When a change is detected like the addition or removal of a resource, Hava will send each recipient a diff diagram showing the changes.

Now you and your security team can be across every change as it happens so you can assess and take action if required.
Hava is a web app that can be used over the internet on a SaaS basis. Once you sign up, you can log in, connect your cloud accounts and let Hava work its magic. Nothing to deploy or maintain, it's all taken care of.
However, some enterprise clients have strict governance or security policies that prevent them connecting to Hava SaaS. In these circumstances you have the option of self-hosted.
You can deploy Hava on your own infrastructure, behind your own security which solves the majority of compliance issues. The self-hosted option is a little more complex as you would imagine, but we have engineers and partners available to ensure your self-hosted deployment is a successful and smooth process.
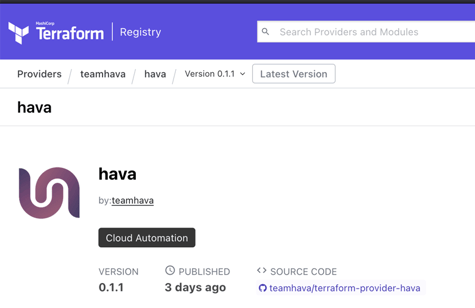
As engineers we appreciate the desire to script and integrate as much as possible in your ci/cd or deployment pipeline. We are constantly building integrations to make that easier.
Currently you can leverage integrations with GitHub and Terraform on the deployment side, and a confluence plug in to take live interactive Hava diagrams into your Wiki.
Also Hava's embedded viewer allows you to take interactive diagrams, restricted diagrams and static diagrams and place them anywhere that supports iFrames.
In conclusion, Hava's automated cloud infrastructure diagrams provide a clear and concise view of your cloud environment, helping to simplify the process of managing and monitoring your infrastructure.
By eliminating manual processes and providing real-time visibility into your architecture, you can focus on more critical tasks and make informed decisions about your infrastructure. Adopting automated cloud diagrams is a smart choice for any cloud engineer looking to streamline their architecture management and monitoring processes.
You can take the Hava Teams plan for a completely free 14 day trial, connect your cloud account and get instant visibility across all your VPCs and virtual networks.
Use this button to learn more:

There are a lot of capabilities cloud executives can leverage when they adopt Hava. Greater clarity, the ability to track and analyse changes over...
Planning for disasters when you are responsible for cloud architecture is essential. Here's how Hava can help.
How a Simple Automated Cloud Architecture Diagram can save the day. Imagine one of your contract engineers inadvertently deletes a critical network...