Features
Cloudcraft vs. Hava
Cloudcraft & Hava Comparison - You might end up using Cloudcraft during your initial designs, but check out Hava once you've got something running in...
In the world of flow charts and mind maps, Lucidchart has gained a strong following and undoubtedly has proven itself a worthy adversary to the likes of Visio, draw.io and Xmind.
Lucidchart's Cloud Insights is an add-on to the Lucidchart manual drag-and-drop drawing application that creates AWS, GCP and Azure network diagrams via manual import of cloud configuration metadata into the Lucidchart drawing canvas.
The Lucidchart CI manually triggered import process attempts to achieve what Hava.io automates natively, which is why Hava is an excellent option when considering a Lucidchart Cloud Insights alternative.
One of the major benefits of accurate network topology diagrams is up-to-date network visibility to assist infrastructure engineers during an incident response. Having to manually refresh diagrams introduces the complication of multiple network configuration changes happening in between diagram updates, making it complicated to track down potential causes of the incident.
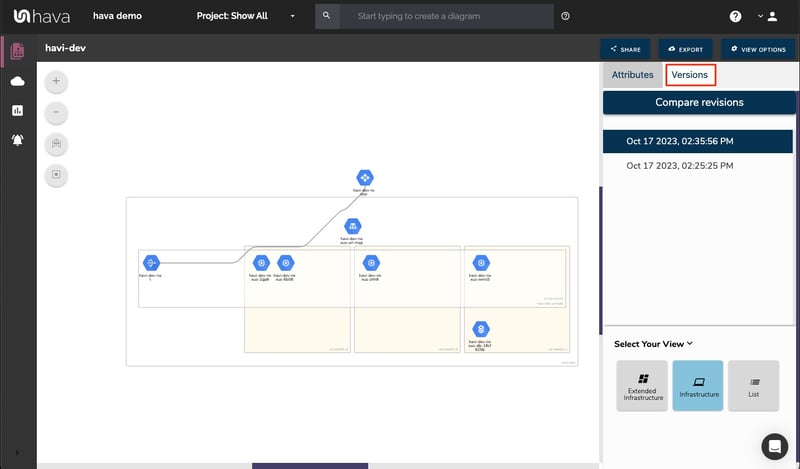
Hava addresses this by continuously polling your cloud configuration and automatically generating new diagram sets every time a change is detected. You can then refer back to the version history which is essentially a complete set of fully interactive superseded diagrams stored since you first connected Hava to your cloud accounts.
If you are new to automated cloud documentation or actively searching for a Cloud Insights alternative due to limitations or price considerations you are in the right place.
There is every chance you or your DevOps and Security team could benefit from better laid out more comprehensive diagrams, security group and traffic visualization, compliance reporting and a fully automated diagram update regime that stores version history that allows you to interrogate network infrastructure that has been superseded.
All these things can be found within hava.io which we believe is the obvious choice for any organisation looking for a Lucidchart Cloud Insights alternative.
Lets take a look at what you can take advantage of when you integrate Hava into your cloud management tech stack.
At the time of writing, the largest vendor in cloud space is Amazon Web Services. Creating AWS diagrams with Hava is as straightforward as creating a set of cross account role credentials and plugging them in.
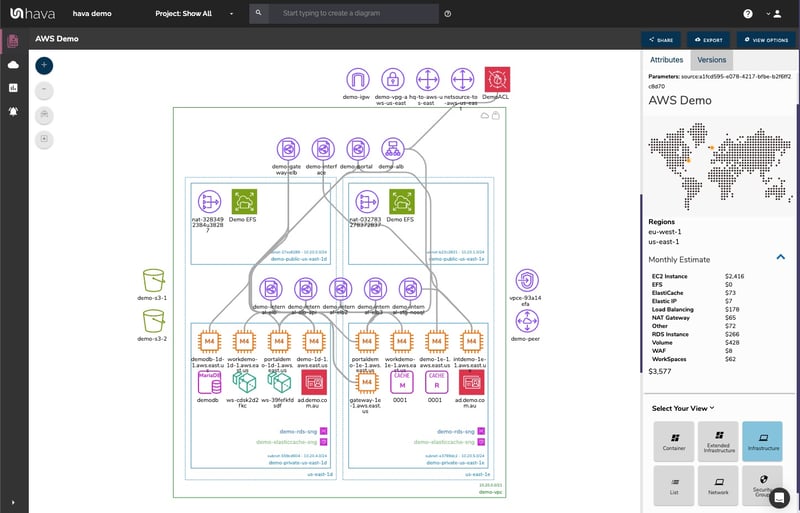
The diagram is logically laid out by VPC and has separate columns for each availability zone detected. Within the AZ columns each subnet found is visualized and contains the individual resources. This is generated at the time of connecting your AWS data source via a read-only cross account role. Once connected, Hava continuously polls your AWS config metadata looking for changes and automatically generating a new diagram set when changes are detected
An overall cost estimate is displayed for the environment in total, however the interactive nature of the diagram enables you to select individual resources on the interactive diagram to take a deep dive into the attributes & metadata. Here you can view any costs and associations that the selected resource has configured.
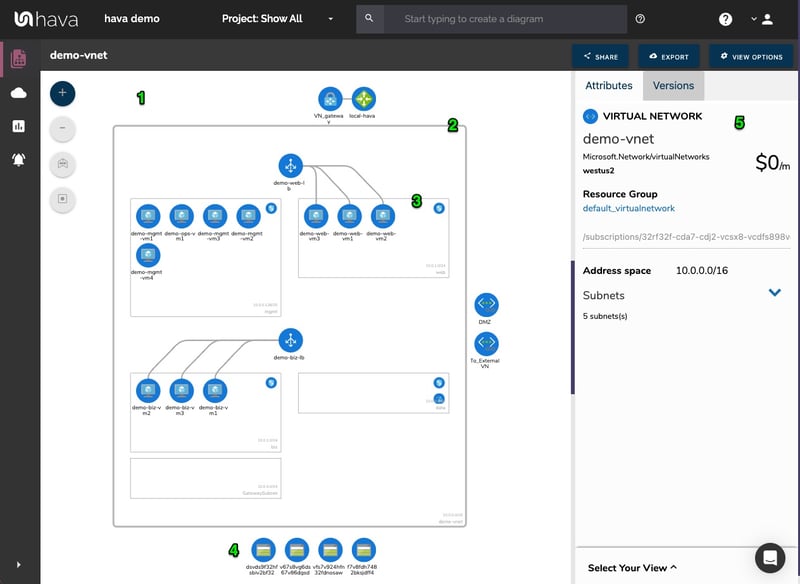
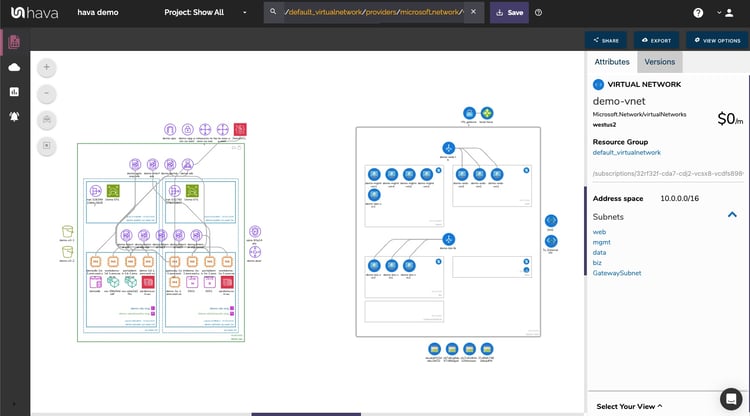
Hava's Azure diagrams are automatically generated and also automatically updated every time a resource configuration change is detected. Which means once set up, you no longer have to manually trigger documentation updates.
The diagrams are fully interactive, with each resource group containing virtual networks and logically laid out subnets, providing a much cleaner and easily understood network topology diagram. As with all Hava diagrams, all the attributes and metadata are available right on the diagram for each resource and can be viewed by simply selecting the resource you wish to interrogate.
Just as with AWS and Azure, all you need to do is create a set of read-only credentials, connect them to Hava and you'll have automatically generated, perpetually updated GCP diagram sets and a version history that you can interactively inspect as if it was the current live configuration.
Increasingly, DevOps and cloud engineers take advantage of the strengths of multiple cloud platforms when designing application infrastructure. If you need accurate, automated diagrams that contain all the resources from multiple cloud providers, then you'll definitely need an alternative to Cloud Insights.
To achieve multi vendor diagrams, you can create and save custom diagrams from queries. This lets you join say an AWS VPC with an Azure Virtual Network and/or a GCP project or VPC. There is no restriction on the combination.
Once the custom diagram is saved, the same auto update and version history rules are applied. Create once and the diagrams remain up to date automatically.
Using the same query/filter tool, you can create custom diagrams based on a wide selection of parameters.
Hava contains the functionality to create custom diagrams using key environment parameters you specify.
This enables you to customise diagrams to just include the key information that is dynamic and ready to view at a glance.
Custom Environment Diagrams can be used to:
Filter and diagram only the specific components of your environment you are interested in viewing
Combine data from separate environments into one diagram
Combine data from separate cloud providers into one diagram
View specific components from multiple sources on the one diagram
The search and filter box at the top of the environments dashboard is the starting point for creating a custom diagram and contains prompts for the available filters.
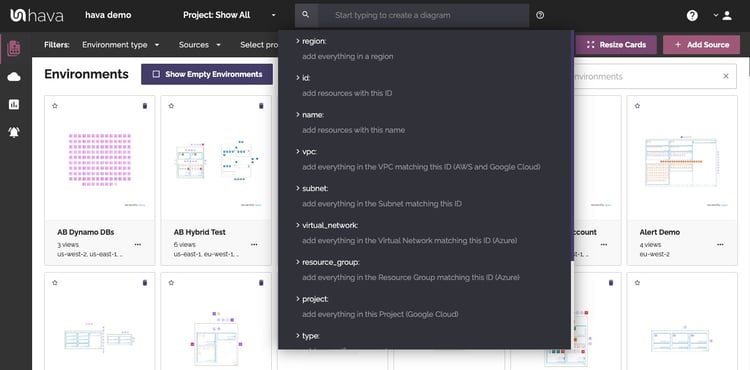
Select or type the required filter followed by the ID of the required resource (no spaces).
You can nominate a single value or stack multiple filters to produce fine tuned custom diagrams.
You could for instance create a diagram for a specific application or a specific client in a Managed Service Provider scenario. You might want to have a master diagram of all the databases you have under management across multiple projects or applications to monitor them in one place. All of this is possible with the Hava custom query tool.
All iterations of Hava diagrams are interactive. You can zoom in/out, use the canvas controls to adjust the layout but more importantly, select individual resources to view their attributes. Selecting the EC2 resource from the below diagram for example changes the attributes pane to display all the knows attributes for the database.
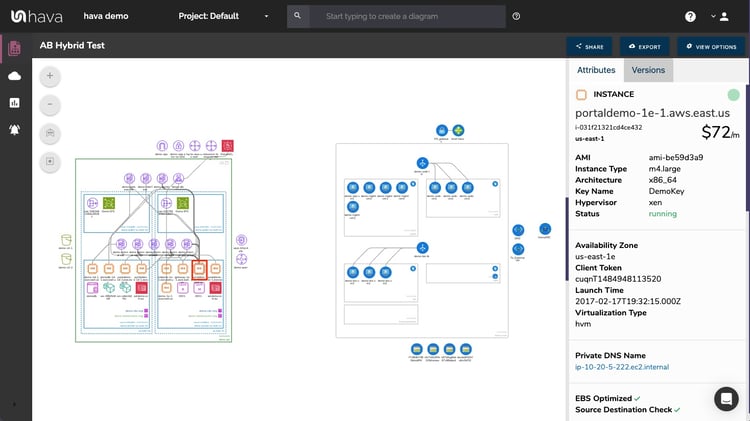
Should any of the settings in the attribute pane also be selectable, you are able to drill down to look at all the other resources connected to that attribute. If you were viewing the attributes for an EC2 instance and selected one of the security groups the instance belonged to, then the entire security group attributes are displayed, even though the security group isn't visualized in the infrastructure view.
One of the unique visualizations you won't find generated by Lucidchart Cloud Insights is the Hava AWS Security View. This unique visualization displays all of your configured security groups. Each group can be selected which then displays all the attributes for the Security Group in the attributes (metadata) pane.
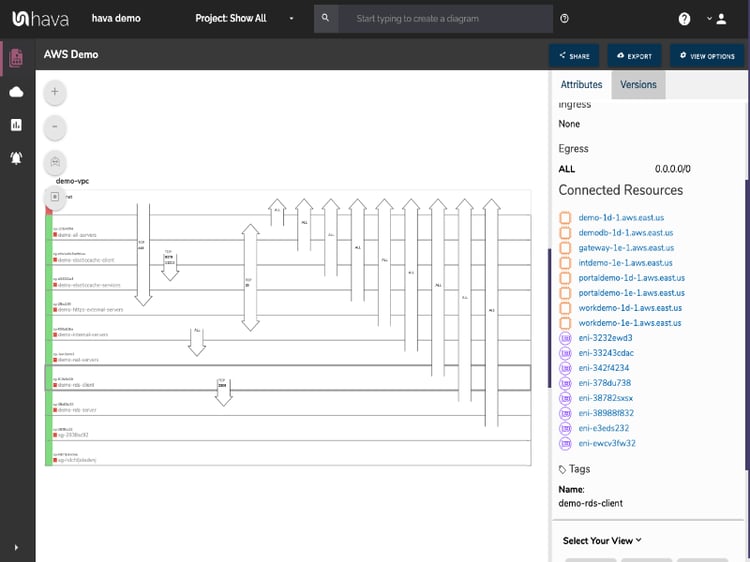
Open ports are visualized on top of the security groups to enable a visual appreciation of the traffic flow and traffic ingress/egress. More importantly, this enables your security team to instantly spot potential security issues.
When you connect your AWS, Azure or GCP accounts to Hava, a few powerful time saving processes are set in motion.
The continuous monitoring aspect is where Hava's Architectural Monitoring capability comes into its own.
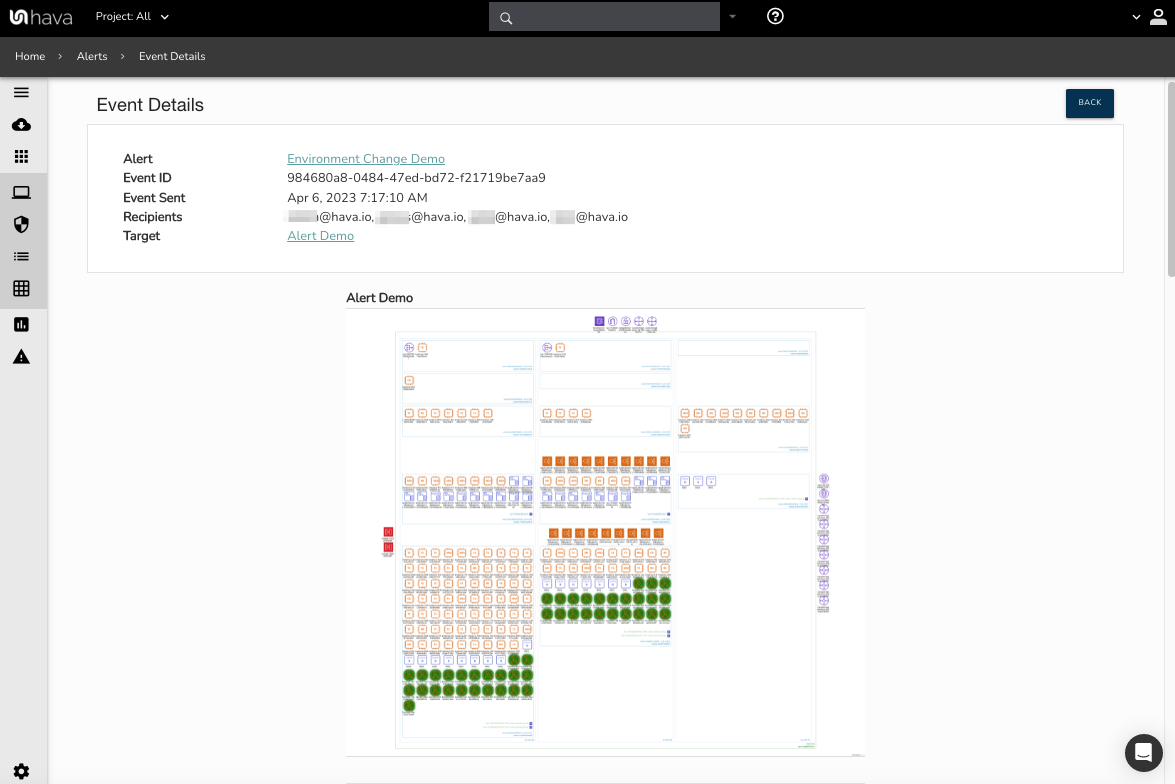
When changes are detected during an automatic sync, a visual representation of the changes detected is created. You specify who should be emailed the notifications. This provides not only an immediate heads up that something has changed, but also provides you with contextual architectural insights to augment any observability platforms you may already have in place.
The recipient receives an email with a Diff diagram highlighting what changed, what has been added and what has been removed from your environment.
You will also get notified when a previously unseen service is deployed. This means if suddenly a Lambda instance shows up and you haven't used Lambda before, you will get a specific alert letting you know.
You can nominate as many people as you like to receive architectural monitoring alerts.
This is particularly useful for security teams, especially if you have a large developer team or multiple teams constantly deploying infrastructure changes. It helps your security team monitor infrastructure and pick up on unexpected changes and any associated security issues.
Hava has a fully featured API enabling the integration and animation of network documentation artifacts into CI/CD build pipelines like Terraform.
You can also leverage the API to create bulk data sources in a large enterprise scenario, download diagrams for off-cloud storage, initiate diagram synchronisation ahead of the normal sync schedule. There are lots of use cases for Hava's fully documented API.
The ability to drag and drop non existent resources onto a diagram is where we choose to differ from almost all applications in this space.
Hava diagrams are 100% generated from your actual cloud configuration.
We believe that the minute you introduce manual "adjustments" to what is essentially documentation that represents the source of truth, then you can call into question the accuracy and validity of your documentation. Dropping a firewall WAF ACL onto your diagram won't stop network intrusions in the real world.
This means your diagrams are created in seconds or minutes without you having to waste any valuable time creating anything manually.
If you do need to annotate or embellish documentation, then we provide options.
The only way to manipulate Hava diagrams is to export them. This ensures the diagrams held within your dashboard remain true and accurate.
There are a number of export options.
To take the completed image, you can export to PDF or PNG image formats.
If you require the raw data, then the CSV or JSON file export will allow you to do that. This can be especially useful if you need to Diff large environment diagrams to quickly identify resource configuration changes causing problems.
If you need to manipulate infrastructure diagrams to say add proposed resources for a configuration change proposal, or embellish the diagrams for management reports or presentation purposes, then the VSDX file export will assist with this.
The VSDX file can be opened and edited with Visio and other programs that support VSDX file formats like draw.io
Understandably security is top of mind when it comes to connecting your corporate cloud accounts to third party software.
We take every measure to ensure your configuration data remains safe and secure like using encryption at rest, insisting on read-only access and only storing configuration settings, never database or user file contents.
That said, sometimes enterprise clients insist on running Hava from within their own infrastructure, which is where our Self-Hosted solution comes into play. Running Hava is entirely possible from you own AWS, GCP or Azure infrastructure, with zero call home network traffic. Once installed, we'll notify you when updates are available and you can pull the updates into your ecosystem.
We truly believe Hava provides the best diagram layouts out-the-box for your AWS, GCP and Azure network topology diagrams and has the simplest subscription as well as security, scalability and performance for even the most demanding enterprise.
Hava makes sense for consultants and MSP's who need to quickly understand a new client's environment before making changes or recommendations. Hava visualizes key cloud governance data along with metadata saving you time switching between diagrams and cloud consoles giving your team up to the minute line of sight on your network topology.
Hava also provides unique security views giving your security team the ability to easily verify architecture from a security perspective.
With the easily understood, clean, logically laid out network diagrams Hava provides you with the assets for any stakeholder looking for a simple overview of your network topology, yet contains powerful easily accessed attributes and metadata to assist your infrastructure engineers when modifying your network or quickly responding to incidents.
If you are looking for a viable Lucidchart Cloud Insights alternative, we invite you to take a look at Hava.


You can take a 14 day free trial at any time, no credit card required.
Cloudcraft & Hava Comparison - You might end up using Cloudcraft during your initial designs, but check out Hava once you've got something running in...
Are you looking to reduce your cloud computing costs in 2023? In this post we look at several opportunities and how Hava can help.
If you are looking for a viable Cloudcraft alternative, drag and drop free, that generates AWS, GCP, Azure and hybrid diagrams, with security...