aws
Generate Amazon AWS Architecture Diagrams
When you auto generate AWS architecture diagrams, visualize security configurations and create new versions automatically every time your network...
The best and most perfect cloud architecture is next to useless if no one in your organisation understands it. What maybe even worse is if everyone misunderstands it, which is why we believe accurate documentation is an essential step in network architecture design and implementation.
Taking that one step further and automating your AWS diagrams ensures that you are visualising exactly what has been physically implemented.
Automation removes the possibility of documentation including resources that were in an initial design but never actually configured. It also ensures that as soon as configurations change, the documentation reflects the new state of play.
There are stakeholders at all levels within organisations leveraging cloud infrastructure to which accurate documentation can prove invaluable. These would include management looking for a simple helicopter view of your cloud architecture, engineers wishing to ensure the infrastructure design has been executed according to plan, new engineers or external consultants needing to get up to speed with a network quickly and security teams needing to identify potential issues with new and existing infrastructure.
Using Hava.io's fully automated AWS Diagram Generator makes this process simple.

Using Hava to generate AWS infrastructure diagram sets is as simple as creating a read-only cross-account role and using those credentials to connect your AWS account to Hava.
Paste the Role ARN into the Hava dialogue box, add an optional name and click "Import"
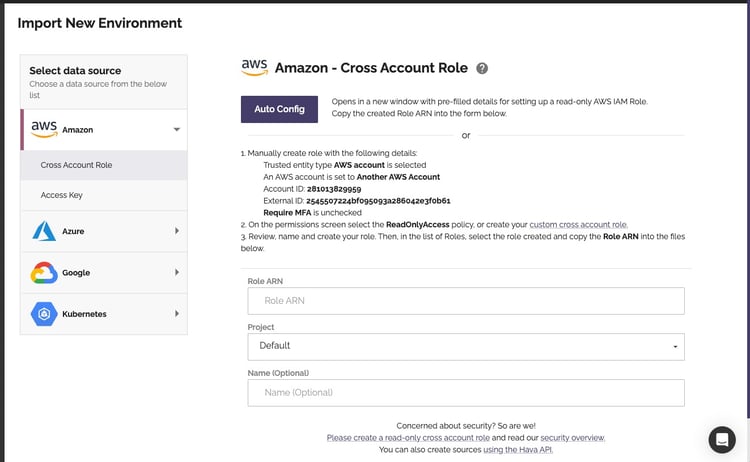
Hava will connect to your environment and pull back the resources and relationships between them and build a complete visualisation of your environment in several diagram views.
Let's take a look at the different views of your network topology automatically generated by Hava.
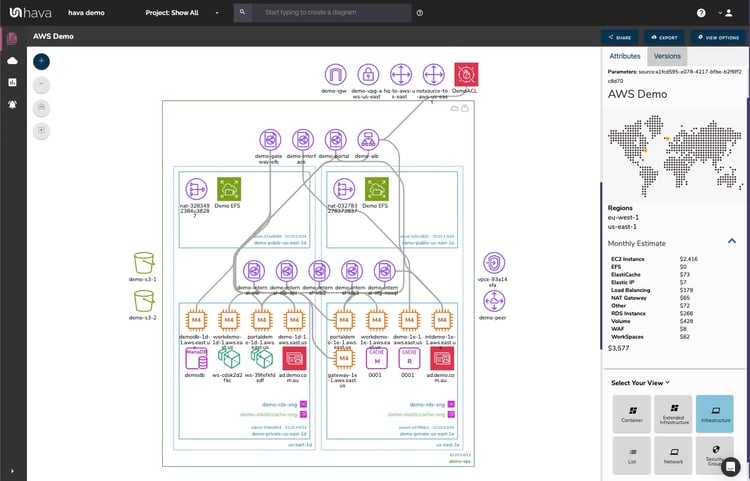
Your AWS network will be visualized by logically laying out one VPC per diagram. The AWS regions discovered are represented by the columns within the VPC. Each region will contain your subnets configured within each region.
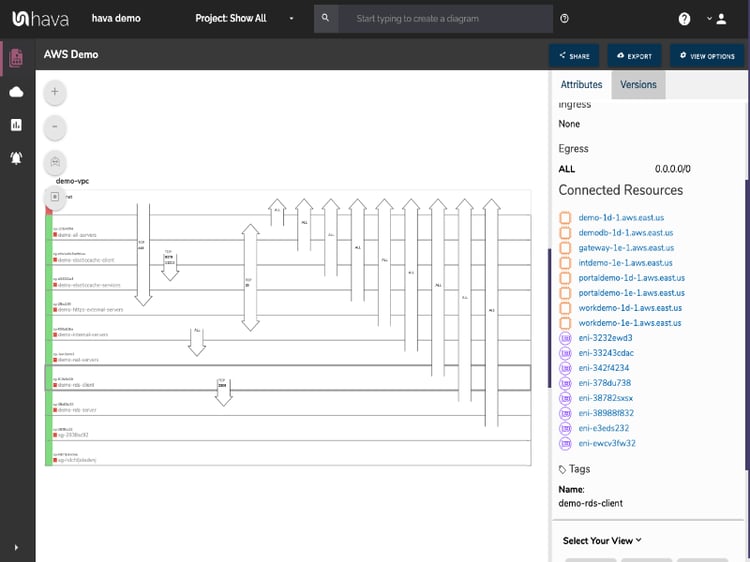
With your environment visualised in this "Infrastructure View" you can select items and resources displayed on the interactive diagram to dig into the attributes of the selected resource, subnet or VPC.
This view gives you a visual prompt in relation to the regional redundancy built into your network design. Can your application survive an individual region outage?
You are able to optionally display resource names and connections which by default are not displayed to keep the diagram uncluttered. There are manual canvas controls to scale and adjust the diagram. The standard infrastructure view out of the box provides the key information needed by Engineers, DevOps and Management and saves you hours or even days of tedious drag and drop diagramming.
Being automated, your diagrams will reflect exactly what is running now in an easy to understand environment visualization.
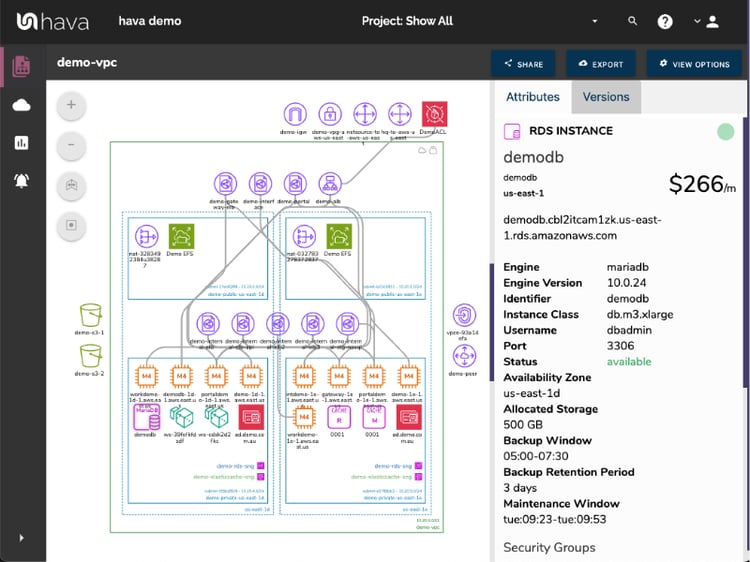
Far from being a static diagram, all the diagrams and reports created by Hava are fully interactive. Clicking on a VPC, Subnet or individual resource will change attribute pane on the side of the diagram to display contextual information about the resource you just selected.
Should there be settings or items in the attribute pane that are selectable, doing so will reveal further information and details about that resource. When viewing the attributes of a top level VPC for instance, the security groups will be shown. Hovering over a security group name will highlight on the diagram all the resources that belong to that group.
Similarly, clicking on the security group name will change the contents of the attribute pane to the attributes of the selected security group. This means that you can save valuable time by viewing attributes and deeper information about your visualized resources directly on the diagram without having to exit out to your AWS console.

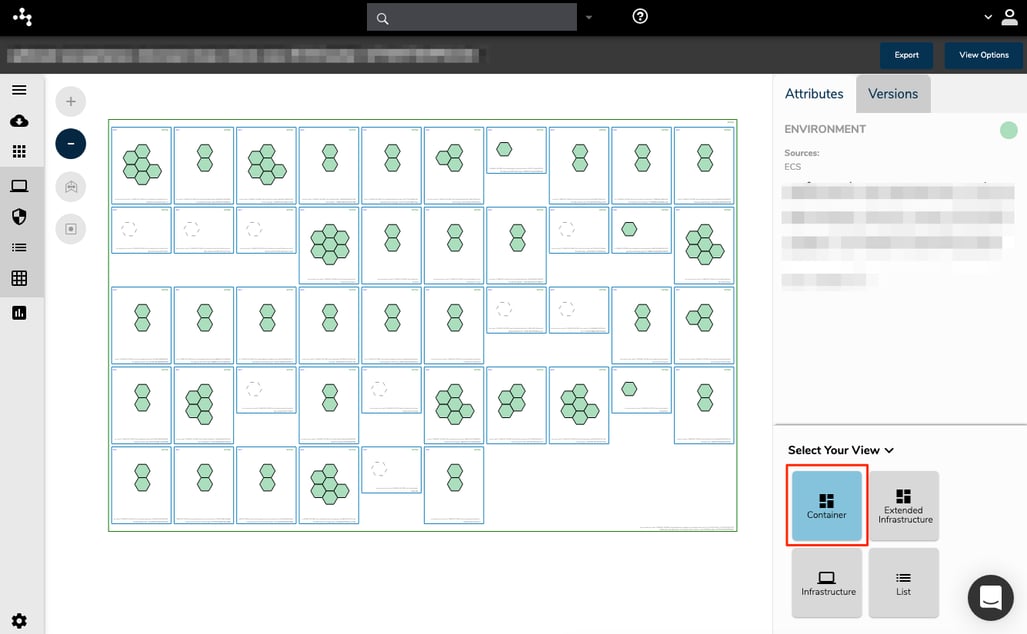
If you are building containerised solutions using AWS, Hava will visualise these in a "Container View" diagram.
The below diagram depicts an ECS Cluster with multiple ECS Service instances within the cluster that contain multiple tasks per service.
The task status is represented by different colours for "Running", "Pending", "Stopped" etc
Colour codes include Green = OK, Yellow = Transitioning, Red = Warning, White = Stopped or Empty which gives you an immediate visual guide of exactly what's going on and if anything needs attention.
One of the most important aspects of cloud computing architecture design is security and security should be a central component of your AWS diagram toolset.
Visualizing your AWS security configuration allows your security team to immediately see what security groups have been set up, what ports are open and how IP traffic enters and exits your network.
A visualized security configuration can instantly highlight vulnerabilities like open ports or network ingress points that have been misconfigured. Your security team can potentially pick up problems in seconds that may otherwise go unnoticed or take hours to uncover trawling through console settings.
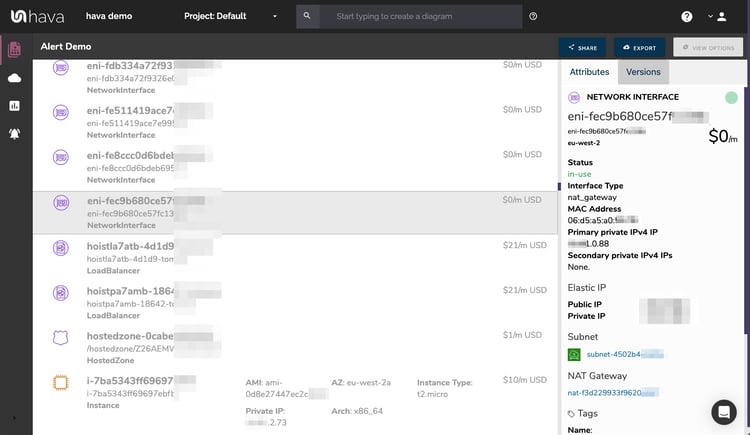
Some discovered resources in your AWS configuration don't make sense to visualize on an infrastructure diagram. Trying to cram 50 network interfaces, or 100 storage volumes onto a diagram just makes the document cluttered and difficult to read.
That's not to say you don't need to know about the storage volumes, network interfaces, WAF rule sets etc which is why another "view" provided by Hava is the List View. This view lists all of the discovered resources both visualized and not and allow you to sort them and export them.
This is particularly useful when trying to evaluate the cost estimates of all your configured network components from most expensive to least.
While automatically generated AWS diagrams delineated by VPC are incredibly useful and time saving, sometimes you need to diagram specific elements within your VPC or to collate resources from different VPCs or even different cloud providers.
Hava's toolset addresses this with a very flexible query and search tool that allows you to build custom diagrams based on numerous criteria like region, resource name, VPC name and even leveraging tags and labels for AWS, GCP and Azure.
This enables you to customise diagrams to just include the key information you need that is dynamic and ready to view at a glance.
Custom Environment Diagrams can be used to:
Combine data from separate environments into one diagram
Combine data from separate cloud providers into one diagram
View specific components from multiple sources on the one diagram
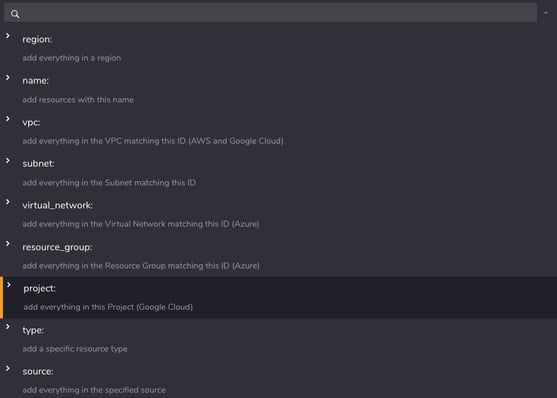
Using the region: search parameter for instance, would return anything in the specified region, including resources in any matching Azure or GCP data sources you have connected to Hava.
Using the Deep Search modifier "@" within the query, the search will also return resources connected to the ones that meet your search criteria when you generate architecture diagram from AWS configuration data.
Just like undocumented or misunderstood AWS infrastructure is challenging, so is keeping well documented architecture diagrams and reports up to date.
The best, most beautifully crafted and accurate diagram sets are only useful up until the time your network configuration changes, at which point they become obsolete and potentially promulgate mis-information to your management and engineering teams both internal and external.
Your AWS network topology documentation should change when your network does and while even the most diligent engineer has every intention of completing a configuration change by updating the associated diagrams and documentation, we've found this step is often overlooked.
Hava continuously syncs your standard and custom diagrams, so an up-to-date documentation set is always at hand. Should you need "up to the second" updates, you can manually sync your data sources at any time to build a fresh set of diagrams on the fly.
While automatically updated AWS diagrams ensure your documentation is always up to date, you may need to know what your network looked like prior to the configuration change. During an audit or unexpected network behaviour you may need to know what the config looked like last month or even 3 months ago.
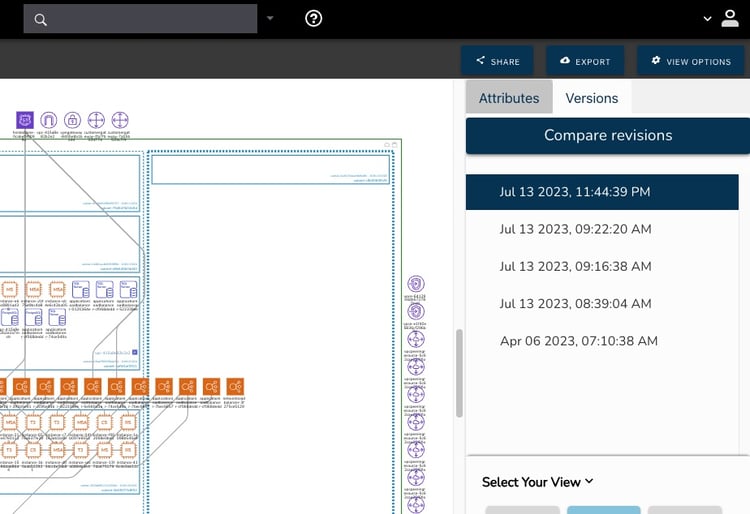
Hava addresses this important requirement by retaining a full interactive document set every time a diagram is superseded. The superseded document set is retained in a version history. The older versions can be opened and inspected interactively just like the current document set and even exported for diffing or external archiving.
This gives you an audit trial of changes to your AWS architecture that allow you to pinpoint when changes were made in the event of unexpected network or application behaviour or sudden changes in cloud compute costs.
Hava continuously scans your AWS architecture and when changes are detected a new diagram set is automatically generated. The superseded diagrams are not discarded or overwritten. Instead they are moved into version history. Still fully interactive.
What this means is you can view your cloud architecture at any point in time and also leverage Hava's revision comparison (Diff Diagrams) to quickly identify what has been added or removed between the two diagram dates.

So you can easily identify all the changes made since your last compliance audit, or see what changed yesterday that is causing unexpected network or application errors.
While diff diagrams are super helpful in diagnosing changes after the fact, you may want to keep on top of changes as they happen.
Hava's architecture monitoring alerts will let you know the minute a change is detected. You simply nominate the environment you wish to monitor and add a group of recipients to receive the alerts. When a change is detected like the addition or removal of a resource, Hava will send each recipient a diff diagram showing the changes.

Now you and your security team can be across every change as it happens so you can assess and take action if required.
Hava has a fully featured API that enables you to pull config data, fire sync requests and any perform number of tasks and functions.
The API can be used to extend Hava's functionality. Customers have documented tasks like adding animated gifs of a network topology diagram as a build pipeline artifact.
The API functions include listing and creating environments, fetching and exporting diagrams in various formats, JSON exports, fetching and creating teams and team members and creating, fetching and syncing your AWS, Azure and GCP data sources.
Hava provides an export function on each diagram type so you can export your diagrams and the underlying data out to your preferred destination.
These options include:
The export function, and in particular the VSDX export provides the ability to edit and embellish your diagrams outside of the Hava application.
Note: Hava does not provide the ability to add or remove elements from automatically generated diagrams in order to maintain 100% accurate and factual diagrams with a version history within the application for audit and compliance purposes.
The Hava SaaS is ready for you 24/7. Simply pick a plan and you'll be set up with a free trial within seconds.
Create a set of read-only credentials and connect your cloud to Hava.
Within a few minutes Hava will map your cloud configuration and produce a full set of interactive diagrams.

We invite you to access a free 14 day trial to any of the available SaaS plans via the button below. No credit card required. You can find out more about Hava here:
While the focus of this post is AWS, Hava also visualizes Azure and GCP network topology and will produce hybrid cloud diagrams containing resources from all three platforms.
When you auto generate AWS architecture diagrams, visualize security configurations and create new versions automatically every time your network...
The quickest way to create an Azure network infrastructure diagram is to connect to Hava. Simply attach a Service Principal and Hava auto generates...
Hava's AWS Network Diagram Generator will automatically generate network diagrams from AWS, hands-free, no drag-and-drop required. Diagrams stay up...