aws
AWS Hybrid Cloud Architecture Diagrams
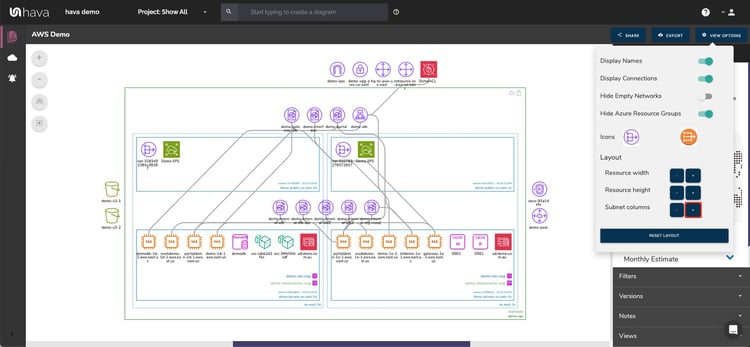
Generating AWS hybrid cloud architecture diagrams is simple with Hava. Automated multi vendor diagrams with multiple VPCs or Projects can be...

We’ve all heard the cliche “A picture paints a thousand words”, but there is real value in using images to explain complex technical information.
Images aid comprehension, grab the reader’s attention and help explain otherwise tough concepts.
Diagrams offer a way for your audience to visually conceptualise complex data. Data that isn’t necessarily easily understood by viewing the data alone.
We process visual images at phenomenal speed. Studies have shown we process images up to 60,000 times faster than text.
A large percentage of the human brain dedicates itself to visual processing. We can process and recognise a familiar object in around 100 milliseconds and can comprehend and understand the meaning of quite complex diagrams almost immediately.
This is in stark contrast to trying to understand the same information in written form.
A simplified presentation of often complex data is a huge advantage when presenting existing infrastructure to internal stakeholders, on-boarding new technical staff or reporting to management in a format they can understand.
Diagrams can easily convey complex relationships that would be a difficult and lengthy process to describe using text and data alone.
Could you imagine trying to describe an organisational chart for a company with 150 employees and 10 departments across multiple geographical locations using just text alone ?
Business constantly needs to disseminate information and the need for speed, accuracy and comprehension is paramount. Diagrams are quick to grasp and greatly enhance comprehension and retention.
Graphics maintain attention. They are often the difference between readers understanding and absorbing the information being conveyed or not.Since the emergence of the much maligned Powerpoint Presentation, visual communication has become the dominant feature of corporate communications.

Annual reports, project prospectuses, sales presentations, advertising and social media campaigns to be effective all contain a healthy proportion of visual imagery to support the underlying information.
Diagrams are now fundamental to communicating in all fields of study, whether that’s science, economics, administration or especially business, there are very few scenarios where enhancing communications with a diagram isn’t accepted or indeed expected.
The evidence is overwhelming that using visual communication is crucial to an effective strategic communications plan.
Let’s face it, we are all under immense time pressure and swamped with more information than we can reasonably be expected to absorb. This inevitably leads to skimming reports.
A well constructed diagram will convey the important information and grab the reader’s attention, even if they skim over 75% of the words on the page.
A picture paints a thousand words | palabras | слова | mots | wörter | woorden !
With organisations becoming more globalised with offices, remote staff, contractors, customers and partners located around the globe the power of the diagram is never more apparent.
Comprehension of complex concepts or technical landscapes is vastly improved when the language barrier is largely removed.
Diagrams and the Cloud Infrastructure Architect
The utilisation of diagrams in a DevOps, Security Analyst or Cloud Architect role is potentially one of the most effective uses of visual communications.
Imagine you have just engaged a new engineer to support your cloud architecture.
How long would it take to explain the current environment?
How much time would your existing team require, to bring the new hire up to speed?
Or worse still, how many days or weeks would it take them to comb through the configuration consoles to work out what’s actually going on.
On the rare occasion infrastructure diagrams exist, when was the last time they were updated?
Given the dynamic nature of cloud computing and the adoption of multi cloud solutions, keeping an accurate visual representation of your cloud environment is essential but without some form of automation, this can be an extremely time consuming and expensive process.
Data comparison is infinitely easier using visualised data.
Take for instance the scenario where network or cloud infrastructure resources have changed.
Using Hava's revision comparison tool allows you to select any two diagrams and run a diff comparison over them visually, so all the changes stick out.
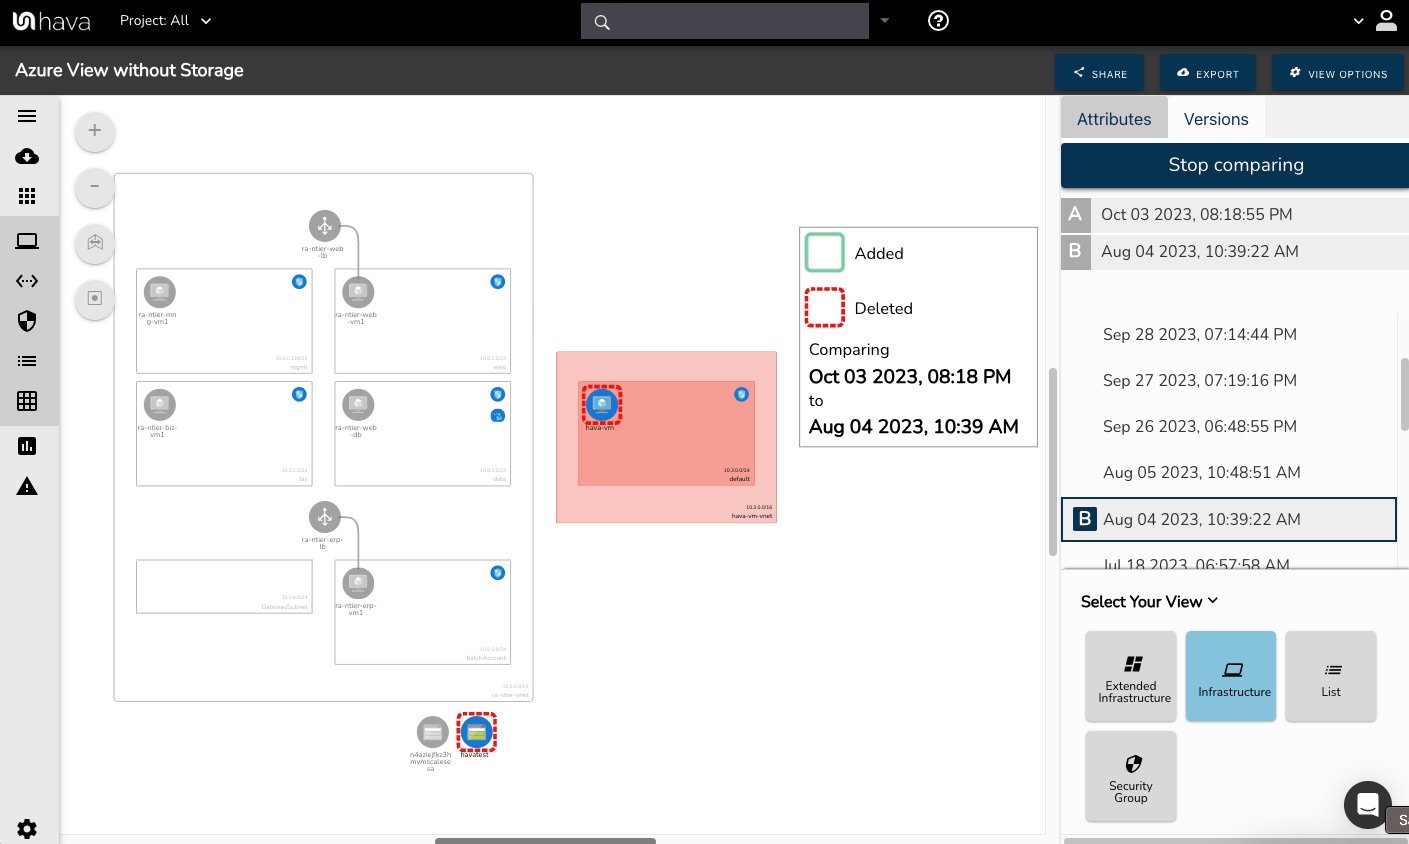
The same can’t be said of the same information in a spreadsheet or say JSON cloud formation data.
Of course it helps if your diagrams are being dynamically updated and version history is being captured automatically when a state change is detected.
It’s not uncommon for resources to be commissioned within a cloud environment and to then remain unused or to be temporarily utilised for testing purposes and then forgotten.
A diagram generated from the actual resources configured in your cloud environment will immediately highlight these orphan entities so you can delete them and avoid paying too much for your cloud infrastructure.
Of course cloud infrastructure diagrams are fantastic as long as they are up to date and you can find them.
In our experience, updating diagrams is a low priority when your workload is heavy and keeping up with dynamic environments is nearly impossible. As soon as you have completed your static diagram, it's probably out of date.
Governance and auditing are a huge consideration in today’s corporate landscape.
Your mission critical cloud infrastructure is probably the lifeblood of your or your client’s business.
At the end of the day your CTO and CEO are ultimately responsible for the continuity of the business.
Keeping the business systems up and running and quickly identifying changes that caused an outage are essential. This is where automated cloud infrastructure diagrams come into their own.
Far from being passive pretty pictures, implementing automated diagrams that detect state changes and record the before and after diagram can be the difference between being down for minutes or days.
Any smart CTO or CEO would ensure they have this covered.
Imagine one of your contract engineers inadvertently deletes a critical network gateway.
Your client's e-commerce site is suddenly receiving zero traffic.
It's your client's busiest day of the year and they are losing $1k / min - what do you do ?
If you’re smart and had the foresight to introduce hava.io into your IT department’s toolbox you can fire up Hava, take a look at the latest state change in the Diagram Version History, quickly identify the missing resource and get your site back online.
Hava is so much more than a simple diagramming tool.
Add hava.io to your toolbox essentials and start :

If you’d like to take hava.io for a free test drive you can learn more here:

To speak to a CSM, use the chat interface on the bottom right of this screen or email sales@hava.io or you can book a call here :

Generating AWS hybrid cloud architecture diagrams is simple with Hava. Automated multi vendor diagrams with multiple VPCs or Projects can be...
The quickest way to create an Azure network infrastructure diagram is to connect to Hava. Simply attach a Service Principal and Hava auto generates...
New visual layout controls allow you to adjust your Hava Cloud Network Topology diagrams. Display your AWS, GCP and Azure diagrams just the way you...