aws
How to Find a Cloud IP Address and Its Associated Resources Fast
When you need to find out which of your cloud resources is using a specific IP address hava makes it easy. No matter how many cloud accounts you...
Managed service providers have the unenviable job of keeping hundreds or maybe even thousands of cloud networks and applications operating at peak performance.
A lot of that work can be reactive. Something changes and breaks a production environment and it's your job to isolate the changes and rectify the problem.
If you have a benchmark to compare against, then you stand a chance of quickly identifying why the current network performance is sub-par or broken.
Depending on the cloud platform, you might be getting alerts or errors appearing in a console somewhere, or tickets being automatically generated from CloudWatch or some other service which will most likely provide the symptoms of the failure, but not necessarily the cause.
Having up to date diagrams of the last known "good" network configuration coupled with the ability to sit them side by side with the current "live" diagram can go a long way to help diagnose the root cause of the problem. If you know what should be running and what is actually running now you stand a fair chance of identifying where to look.
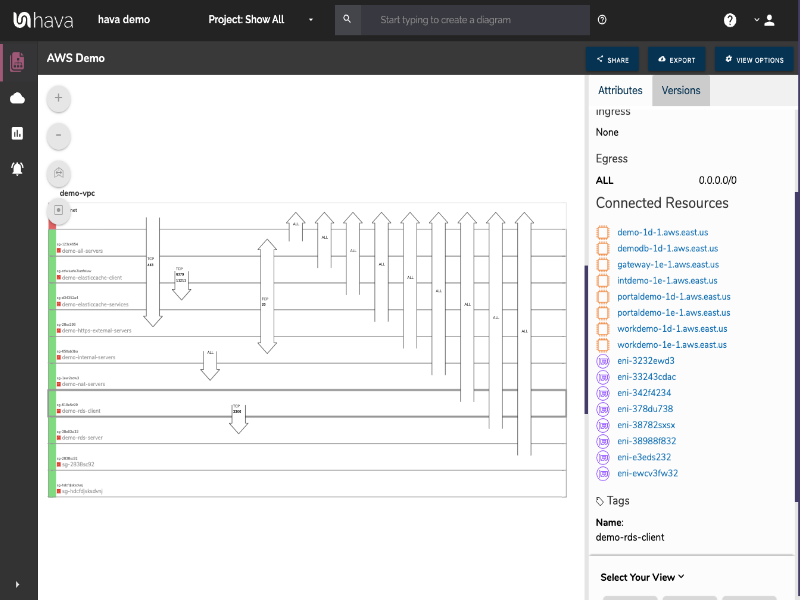
Even if everything looks the same, having the settings and metadata for the running resources available on an interactive diagram allows you to compare key settings like IP ingress/egress, security group settings, open ports, load balancer status and so forth.
So there are many reasons why some of the top global MSPs turn to Hava to help document and manage client cloud infrastructure. These include:
When you have hundreds or maybe thousands of cloud accounts across multiple vendors to manage, having a centralised documentation platform that allows you to search thousands of accounts with a single command is a powerful tool with the potential to save you massive amounts of time.
Say for instance you receive notification that a specific resource version is being discontinued and you need to upgrade to the new version to allow that resource to continue working. In the past that would have meant logging in to hundred, thousands or even tens of thousands of client cloud accounts to identify if any action was necessary. Or even worse, as those resources begin to fail you would need to go into each account one by one to identify if the deprecated resource is the one causing the application or network outage.
Having all your client accounts connected to Hava as a data source would allow you to perform a single search command to pull all the resources of that type back to a single diagram with VPC or virtual network details so you can identify what needs to be done. No need to log in to a thousand consoles.
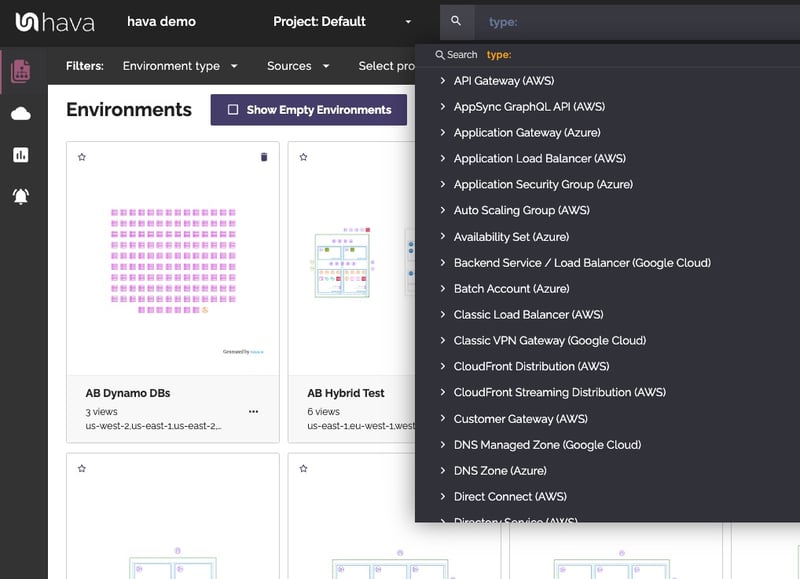
There's no limit to the number of client data sources you can connect and depending on the type of search you perform, you can be searching multiple cloud vendors like AWS, Google Cloud, Microsoft Azure and Kubernetes clusters simultaneously.
MSPs are very often solving the same problem over and over. You can take on a new client and be tasked with creating or improving an environment and you think, I've done exactly what they need before at client... um..um who was that again. If you have a tag or a combination of resources, you can use the Hava search functionality to find the matches and lead you straight to the environment you are looking for.
In the scenario where you have a known data point, like an IP address, resource name or ID, but you don't know exactly which client or environment it belongs to, it could take you some time to track down which client or environment you want.
Using the search/query function built in to Hava you can use a number of system and user generated key/value pairs to track down client environments and individual resources. You can use:
| name: | Find resources with this name |
| vpc: | Find AWS and GCP VPCs matching this id |
| subnet: | Find subnets with this id |
| virtual_network: | Find Azure VN with this id |
| resource_group: | Find Azure RG with this id |
| project: | Find GCP project with this id |
| type: | Find this type of resource |
| source: | Find this source (cloud account id) |
| ip: | Find everything with this IP address |
| id: | Find resources with this id |
| region: | Find everything in this region |
| user generated: | Find any user defined tag/value |
Search queries can be combinations of any of the above using and/or syntax and negative matching so can be as complex as you need.
Hava continuously scans your AWS architecture and when changes are detected a new diagram set is automatically generated. The superseded diagrams are not discarded or overwritten. Instead they are moved into version history. Still fully interactive.
What this means is you can view your cloud architecture at any point in time and also leverage Hava's revision comparison (Diff Diagrams) to quickly identify what has been added or removed between the two diagram dates.

So you can easily identify all the changes made since your last compliance audit, or see what changed yesterday that is causing unexpected network or application errors.
While diff diagrams are super helpful in diagnosing changes after the fact, you may want to keep on top of changes as they happen.
Hava's architecture monitoring alerts will let you know the minute a change is detected. You simply nominate the environment you wish to monitor and add a group of recipients to receive the alerts. When a change is detected like the addition or removal of a resource, Hava will send each recipient a diff diagram showing the changes.

Now you and your security team can be across every change as it happens so you can assess and take action if required.
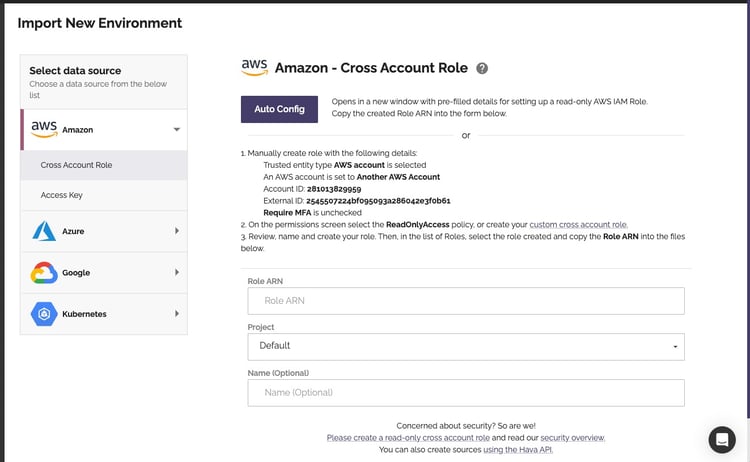
As well as providing a fast way to search through hundreds if not thousands of connected client accounts, Hava's primary function is to provide up to date network topology diagrams automatically. By simply connecting a cloud account as a new data source, Hava will scan the environment and generate diagrams for each VPC, virtual network or Kubernetes cluster discovered.
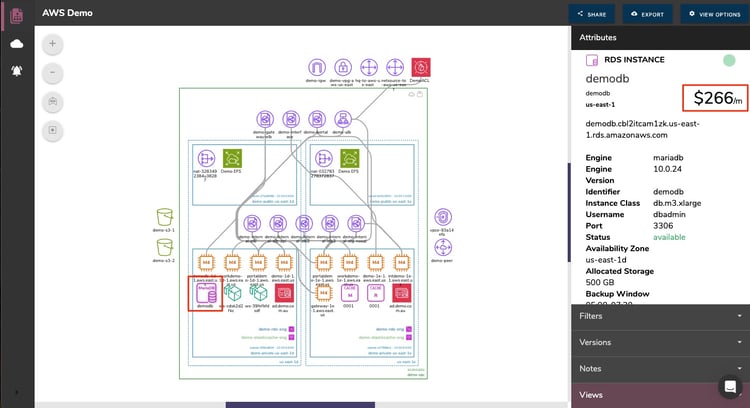
The diagrams are interactive, in that when you select a resource on a diagram, like a database instance, compute instance, load balancer or Kubernetes pod, the attribute panel to the side of the diagram changes to display the metadata relating to the selected resource.
The diagram is 100% auto generated, no drag and drop required which obviously saves you a shed load of time should you need to accurately diagram all the networks you have under management. You would typically assign this lengthy process to junior engineers or tackle it yourself because it's quicker, so using Hava to automate the process frees up both your time and your staff to do more important things.
The automation fun doesn't stop there though, once the diagrams are generated, Hava continuously polls the connected accounts and when changes are detected a new diagram is generated and the superseded diagram is retained.
When Hava detects changes and produces a new diagram the superseded diagram isn't deleted or simply overwritten, it is placed into version history. This versioning approach means you have fully interactive historical diagrams ready to inspect during unexpected performance drops or application outages.
Your client environment may have changed multiple times in between you logging in to check on things, so when you do need to respond to a report of unexpected network behaviour you have an audit trail of network changes to refer back to.
The various versions of the network infrastructure will tell the story of what was running in the past, what changed and can be compared to what is running now.
When an MSP picks up a new account, the first thing you are going to want to establish is what is running where. That could entail hours or days of trawling through multiple consoles, collating data onto spreadsheets or a whiteboard and generally having a thoroughly miserable time.
By connecting the new account to Hava, you can reveal everything that is running in a couple of minutes. You'll have a diagram for each virtual network discovered along with details about all the running resources.
On top of the network topology, if you are managing AWS and/or Microsoft Azure virtual networks you will also receive a security group diagram detailing the security groups, open ports and traffic flow through the network.
These diagrams are incredibly useful when establishing what a new client's network looks like, but they can be of equal utility documenting the networks you build. Not only can you validate that what you intended to build was in fact built correctly but you can use your diagrams to help onboard new engineers or when assigning network operations and support to another internal team. The possibilities are endless but in each case the networks can be visualised and a greater understanding gained in moments by sighting the diagrams rather that spending hours or days working out what is running and how resources are related using a console.
One of the reasons MSPs select Hava for their automated documentation is to meet PCI and other audit compliance requirements.
Because Hava is totally hands free, the diagrams represent a source of truth. There are no resources on the diagrams that do not in reality exist and conversely there are no actual resources that are running but missing from the diagrams.
This means the diagrams can be trusted as an accurate representation of what your client has running and where.
One of the major benefits as reported by one of our MSP clients with tens of thousands of client accounts under management is the ability to identify what has changed since the last PCI audit. Having the ability to show what was running last year at audit time versus what is running today, significantly reduces the time and work the auditors need to do in order to sign off on compliance. And of course having the documentation all up to date and readily available for them is a massive advantage.
When you have a lot of clients to look after, the chances are you will end up segmenting your client base and allocate them to different teams within your organisation. The thing is, you don't necessarily want one team to have access to another team's diagrams and potentially confidential network information.
Within Hava you have the ability to create projects and attach data sources (cloud accounts) to those projects, then within the teams function grant access for individual projects. So the EU team only sees EU account data sources. You could use this to restrict access to a single data source, for instance if you engaged a contractor for a specific task, you could restrict their access within Hava to a single environment.
The teams and projects method of granting access to diagrams and reports is great but requires a Hava log in. If you want to display diagrams outside of Hava you can use the embedded viewer.
The viewer provides an html code snippet of an iframe or image endpoint that you can use to embed a diagram into an external web property like a wiki, support ticket or project management web app like notion.so
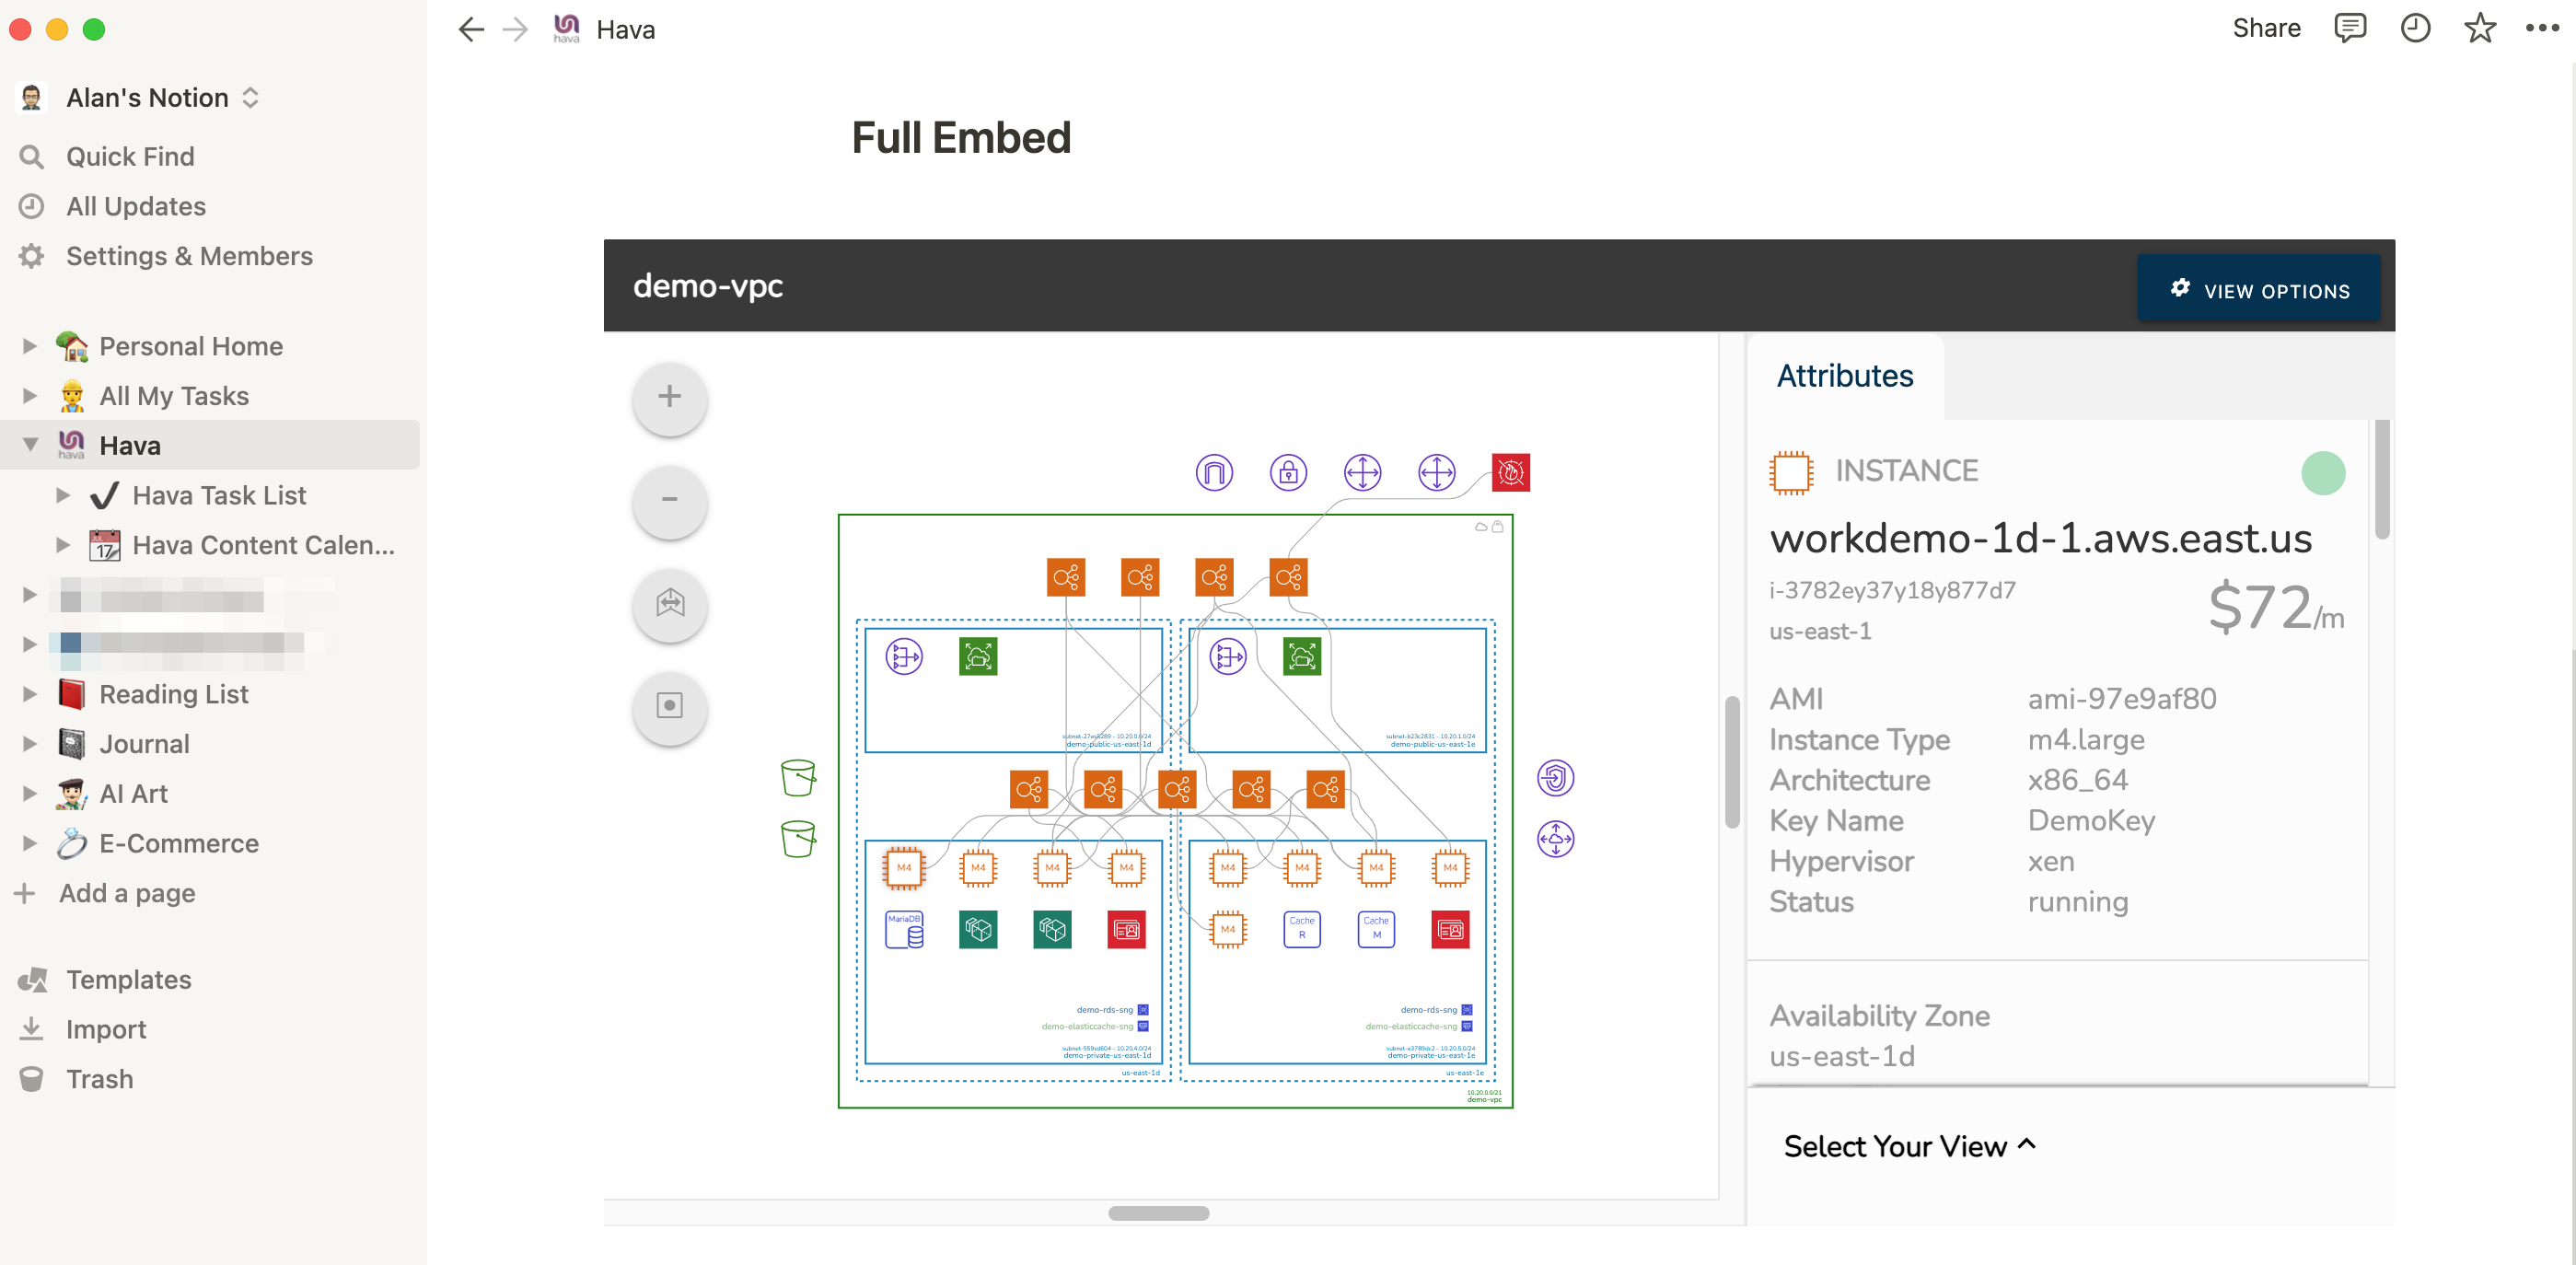
The available option are a full embed like above that will display the interactive diagram just as if you were logged in to Hava. The attribute panel is operational, so as you click on elements of the diagram like the EC2 instance shown above, the attribute pane displays the metadata. you can zoom, adjust spacing, toggle connections and resource names on and off just as if you were logged into Hava.
The second option is the "Light" embed. This provides an interactive diagram, however the attribute pane is removed, so no sensitive metadata like security groups or IP addresses are shown. This is probably more appropriate for publicly facing web properties and gives you as an MSP the ability to show your clients exactly what they have running at any point in time instead of relying on manually created end of month reports.
The third embed option is a PNG file. This is not interactive in any way.
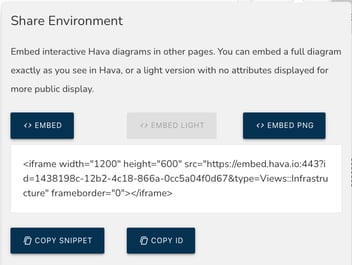
All three embed options point to a dynamic endpoint. This means that you only have to embed once and the target location will remain up to date as the client's environment changes. You don't need to delete and reinsert the code snippets, the diagram at the end of the endpoint updates automatically as the Hava current diagram set updates.
Hava can be run using the online SaaS application which is suitable for most users, however sometimes organisations have security or governance policies that either prevent connecting a third party application to their cloud accounts or require that data stored at rest is held in specific geographic locations.
Whichever restriction applies, Hava can be deployed within your own cloud infrastructure in a single virtual machine instance or preferably as a number of serverless containers using Kubernetes or another orchestration service.
The self hosted deployment runs on your infrastructure and behind your own security infrastructure and firewalls in a region of your choosing which is generally enough to meet any internal security or governance policy requirements.
If you can see potential in using Hava within your MSP business, then please get in touch via sales@hava.io to explore whether Hava is a good fit and to arrange a closer look.
You can also take the SaaS version for a free 14 day trial using the button below.

When you need to find out which of your cloud resources is using a specific IP address hava makes it easy. No matter how many cloud accounts you...
What if you could search through all of your cloud accounts with a single command. Find the resource types, ips, tags, names or ids you are looking...
Finding resources across multiple cloud accounts is time consuming especially if you manage hundreds or even thousands of client cloud accounts. Hava...