aws
Dynamic Cloud Diagrams
If you are running cloud architecture on AWS, Azure or GCP you can benefit from dynamic cloud diagrams generated with Hava.
Amazon CloudWatch is an AWS service designed to help you monitor the performance and health of your AWS resources and applications. CloudWatch initiates communication with other services in response to events or schedules. CloudWatch will also aggregate logs from other services and aggregate notifications and alarms from groups of services onto a customised dashboard.
The primary function of CloudWatch is to track resource and application performance based on metrics you define. Setting an alarm for resources that exceed a specific metric, you can tell CloudWatch to perform a specific task when an alarm is triggered. The task could be to send a notification, or invoke a lambda function to perform a task in response to the alarm.
CloudWatch also collects and monitors log files from services like EC2 instances, Amazon CloudTrail, Amazon Route53 and many more services.
Cloudwatch is comprised of three major components being Metrics, Alarms and Events.
A Metric is a specific data point from one of the resources you are monitoring, a typical metric to monitor might be the CPU usage percentage of an EC2 instance. There are a number of metrics that are automatically built in to AWS service like EC2 and are sent to CloudWatch by default every 5 minutes. You can set up detailed monitoring to increase the frequency of communication between an AWS service and CloudWatch and you are also able to create your own metrics to pass to CloudWatch in addition to the metrics already built in.
An alarm tracks the data points you define and will trigger when the value of the tracked metric exceeds the defined value for a nominated period of time. Say for instance if an EC2 instance CPU usage exceeds 80% for more than 5 minutes, the alarm will send out a notification message to the nominated destination.

The destination for the notification could be a SNS topic that could then send an email alert or SMS notification, or the notification could be sent to an autoscaling policy to trigger scaling out an auto scaling group in response to heavy load on an instance CPU.
The same is true in reverse, you can set the alarm to trigger when CPU usage is lower than a defined threshold and trigger an event to scale in unused instances.
Cloudwatch events can monitor your AWS resource instances and deliver near real-time stream of event data as the AWS API is triggered. This data can be used to send to other AWS resources such as other EC2 instances, Lambda functions, SNS topics and SQS queues.
You are also able to generate application level events that are sent to cloudwatch as well as set up scheduled cloudwatch events that perform tasks at set periodic intervals, like say invoking a Lambda function at 6pm daily to stop all your EC2 instances overnight.
Some examples of Cloudwatch Alarms could include
When the alarm event is triggered, there are a number of actions you could set up which could include:
CloudWatch will also gather information and make the statistics related to the metrics being sent to it available on the AWS management console or on custom dashboards. An example would be the capture of the average CPU usage for an EC2 instance. You can use this statistic value as a trigger for an alarm which could be used to warn when unusually high or low resource activity is detected.
CloudWatch can monitor system events and custom application metrics and then respond by actioning event based rules.
System events like an autoscaling group scaling out, an EBS volume being created or the status changing on an EC2 instance could trigger an event based workflow. When the event is detected the event-based rules could trigger actions like provisioning an new EC2 instance, running a lambda function, triggering Amazon Kenisis streams, running an EC2 Container service task or triggering an SQS queue or SNS topic event.
CloudWatch scheduled or time based events can also be set up to fire at a specific time to run similar tasks like stopping or starting services, state logging or running a lambda function. You could for instance trigger the snapshot of an EBS volume and then send a message to an SNS topic that will alert everyone subscribed to that topic via email or SMS that the snapshot was completed.
You can aggregate logs from the instances and functions running in your AWS account even if they are only in existence for a short time. CloudWatch Logs utilises an agent in Ubuntu, Amazon Linux and Windows to monitor logs for specific patterns, values or phrases and sends the instance log data to CloudWatch logs.
From there, the log data can be passed through to an Amazon EMR job, archived to an S3 bucket, streamed into Amazon Kenisis or displayed in the AWS Management console.
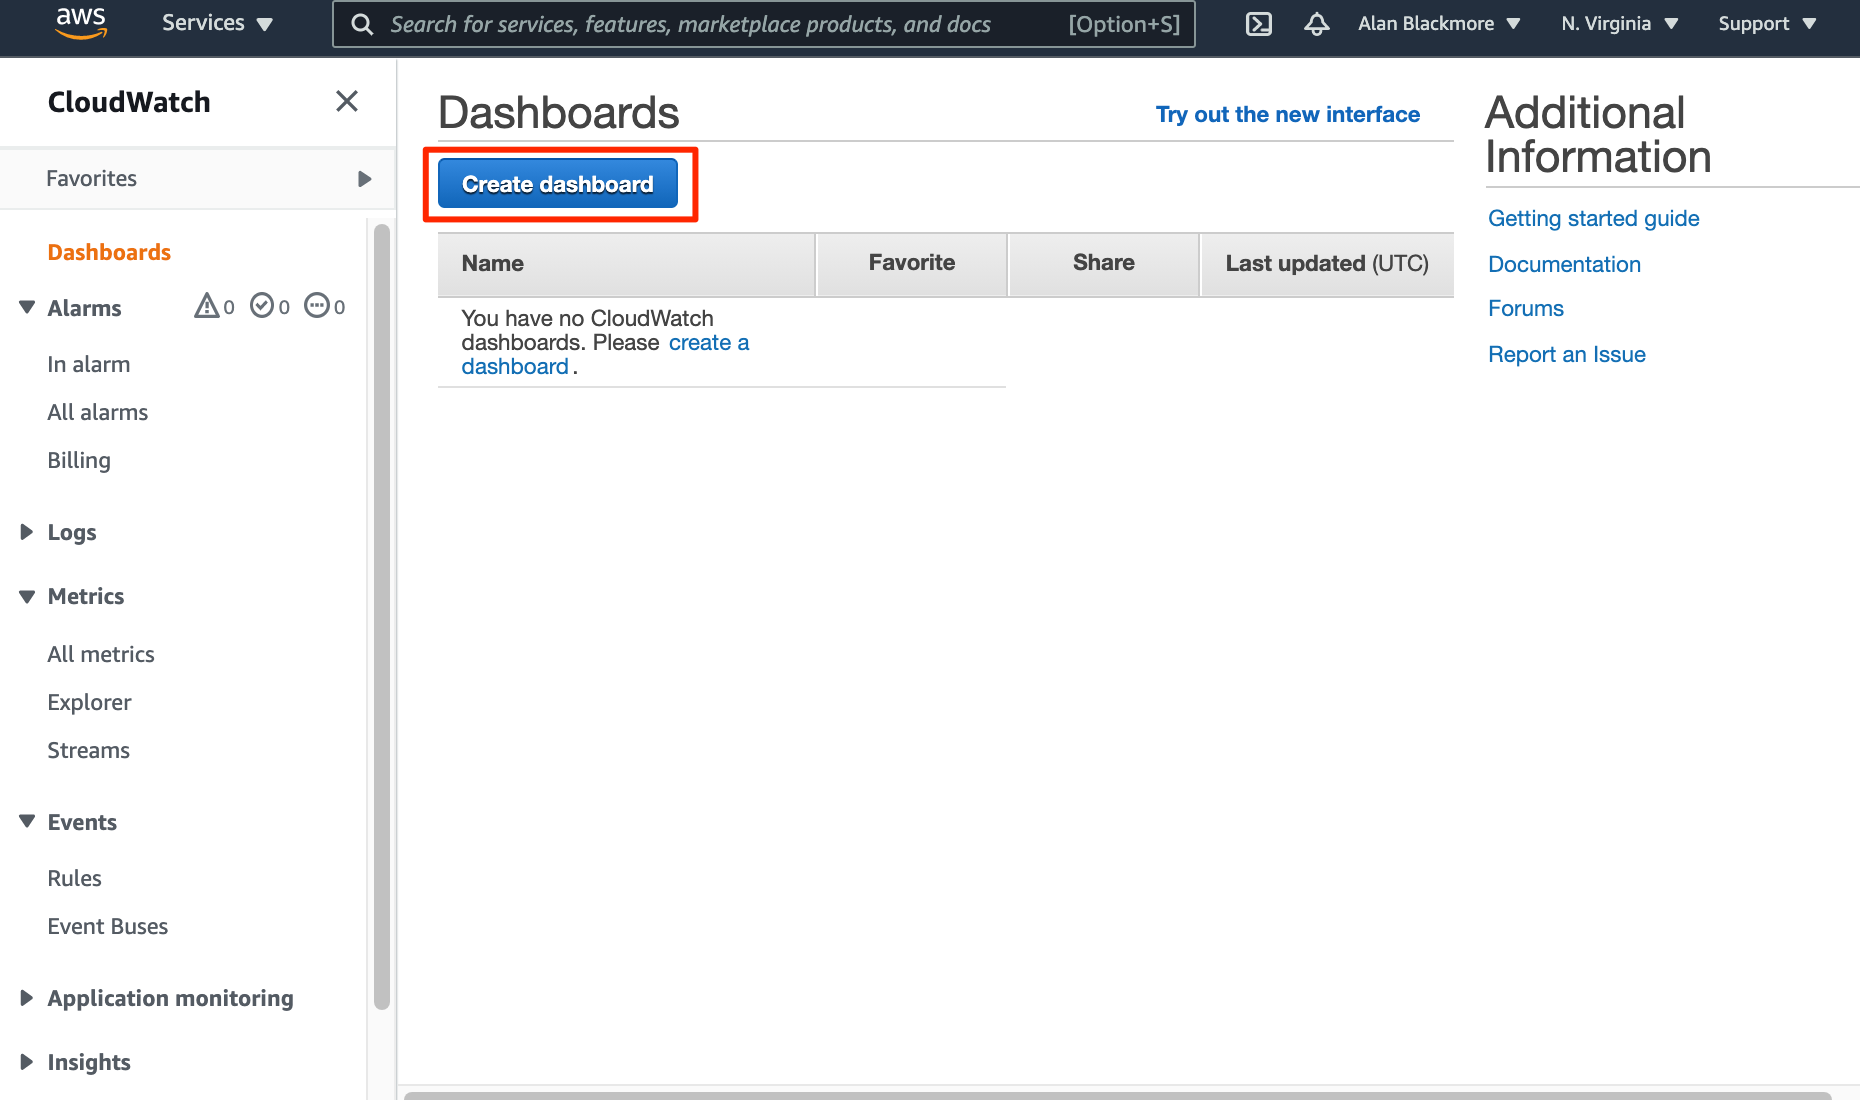
CloudWatch Custom Dashboards can be created to group together metrics and data from multiple sources and regions into a single view. To create a dashboard, go to the dashboards menu in CloudWatch, select add new dashboard,
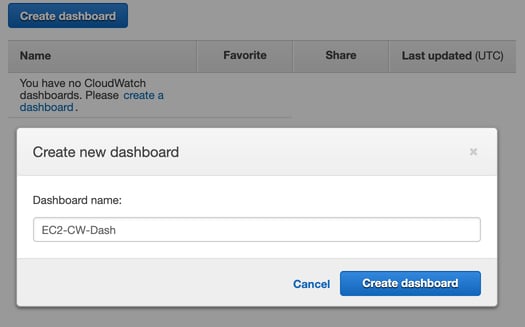
Then you need to name it.
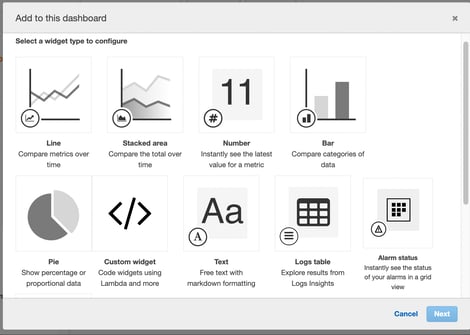
and add the widgets you would like from the options provided which include graphs, metric number values and text.
You can for instance add a Metric Graph, that will prompt you to name it. (We’ll call it EC2 Metrics)
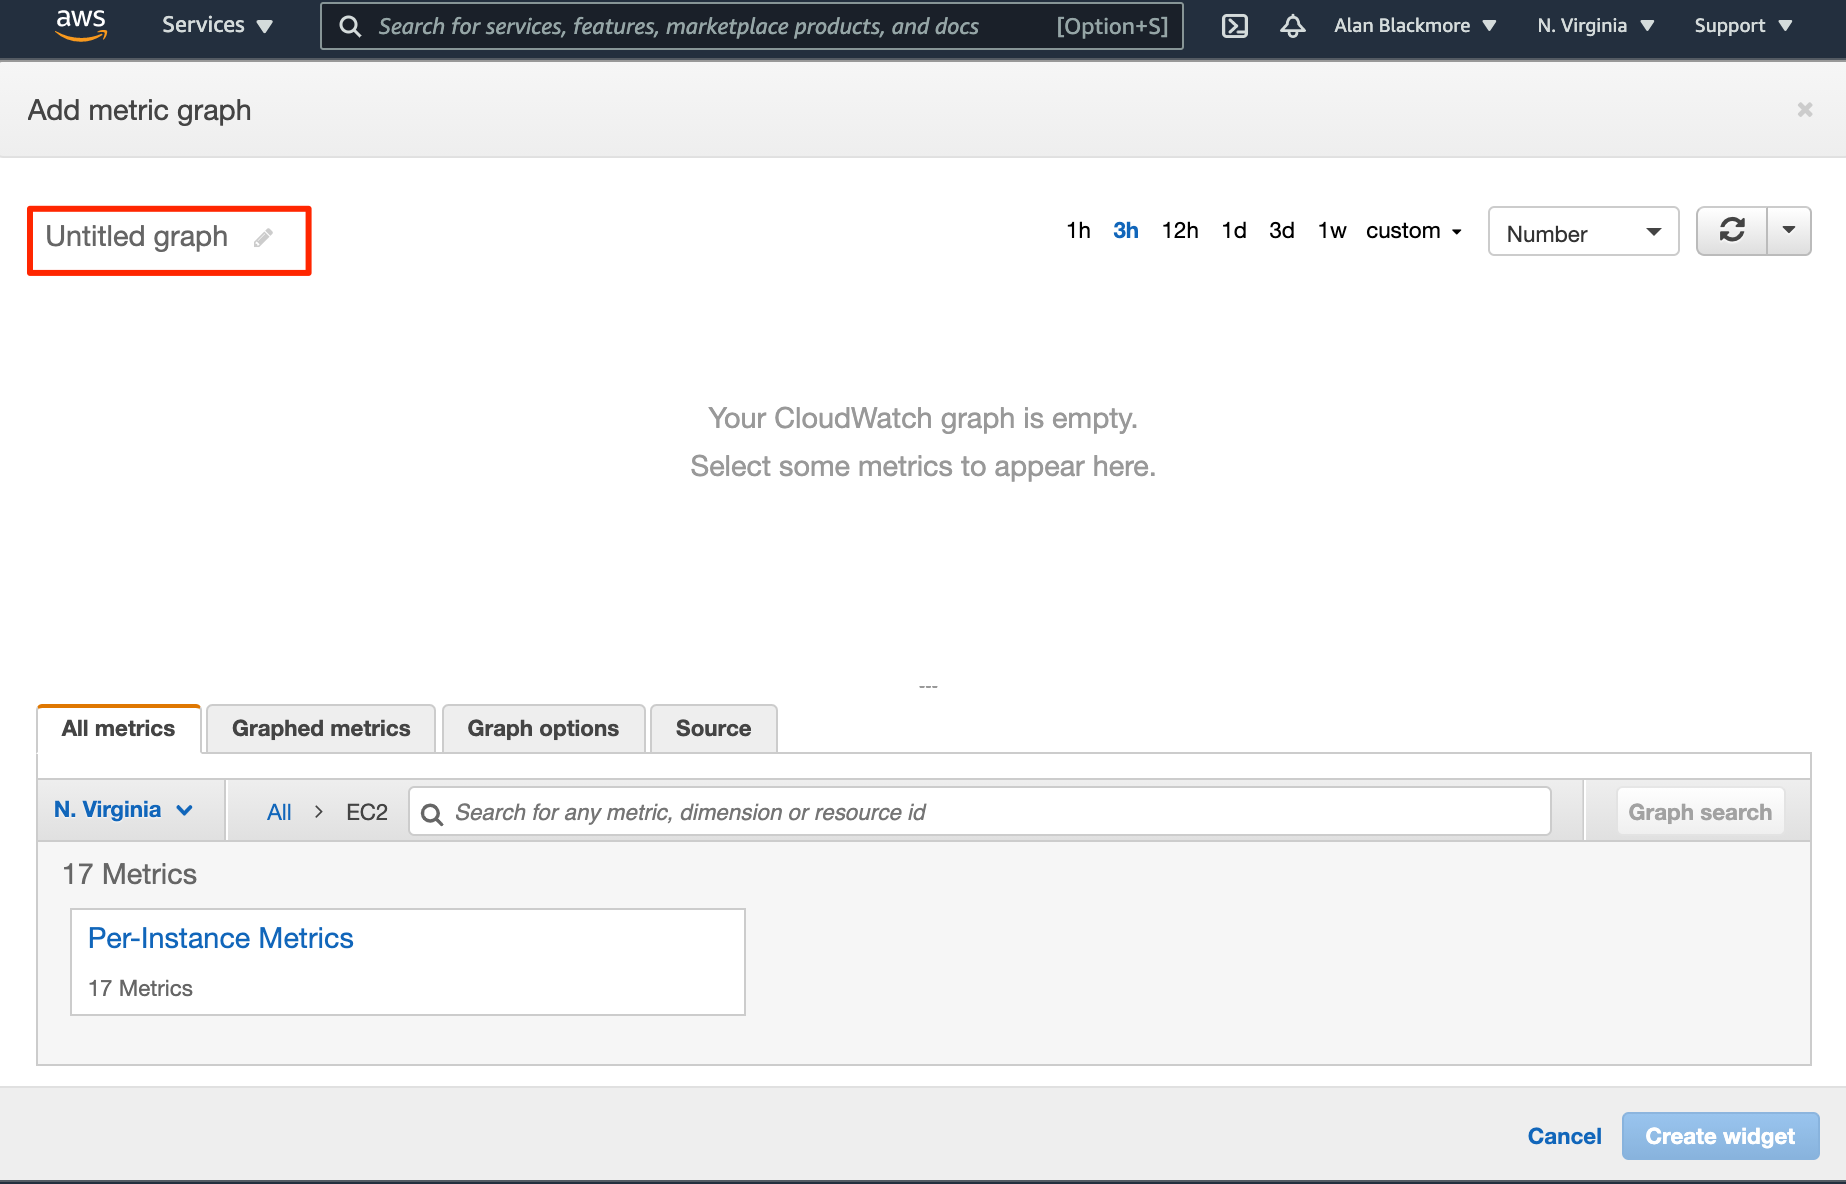
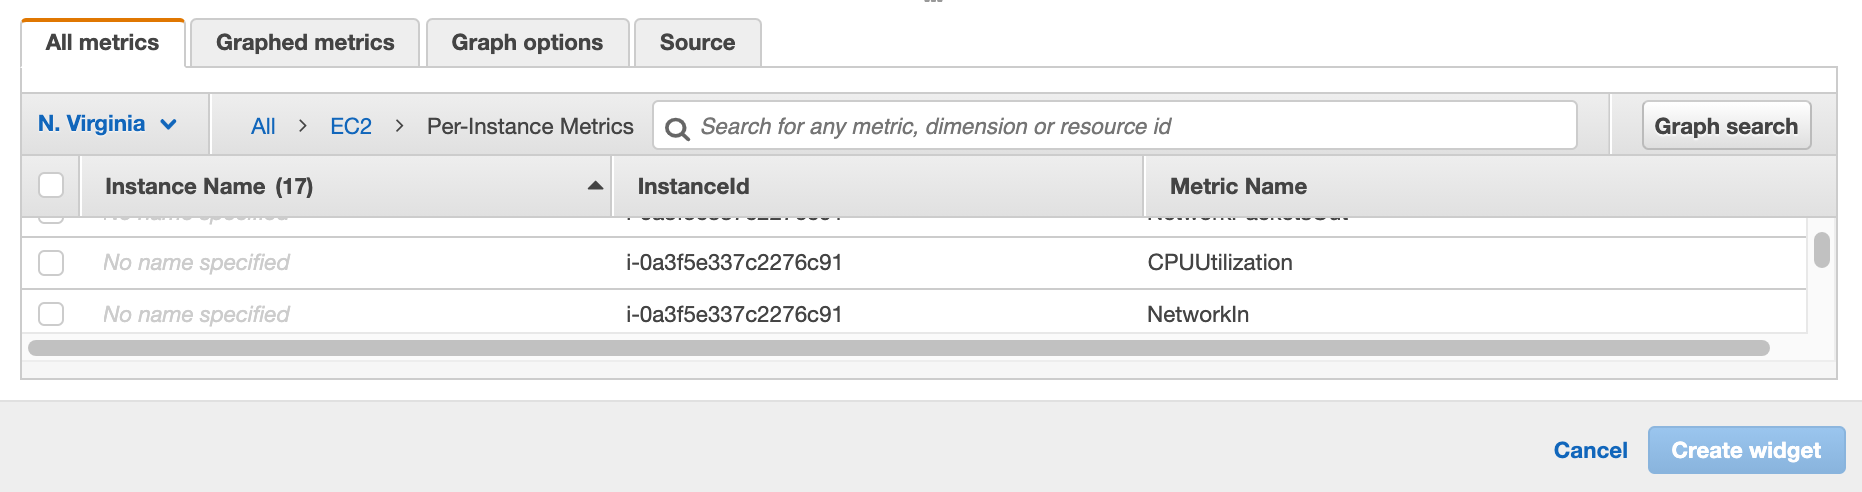
Then select the metrics you want to monitor.
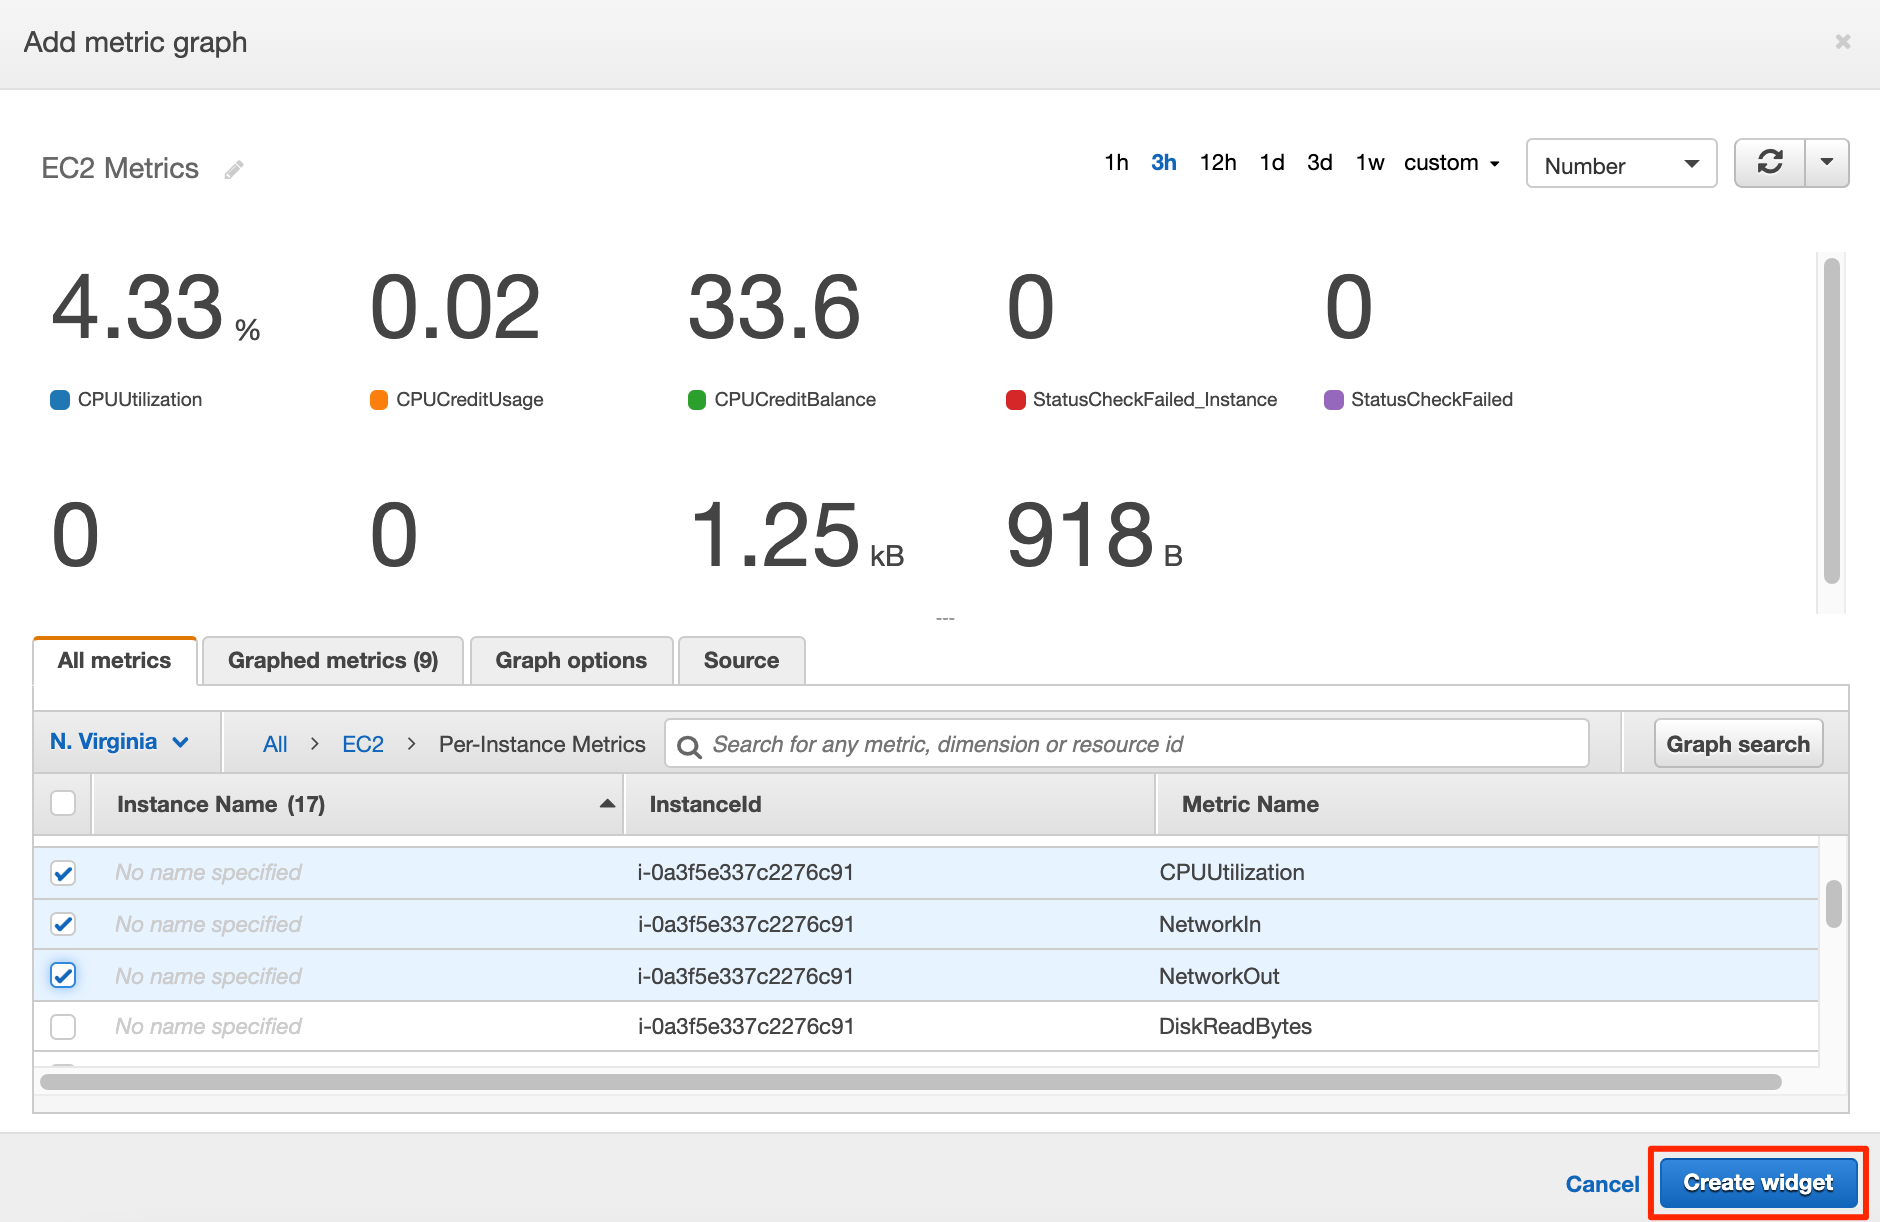
Then click create widget
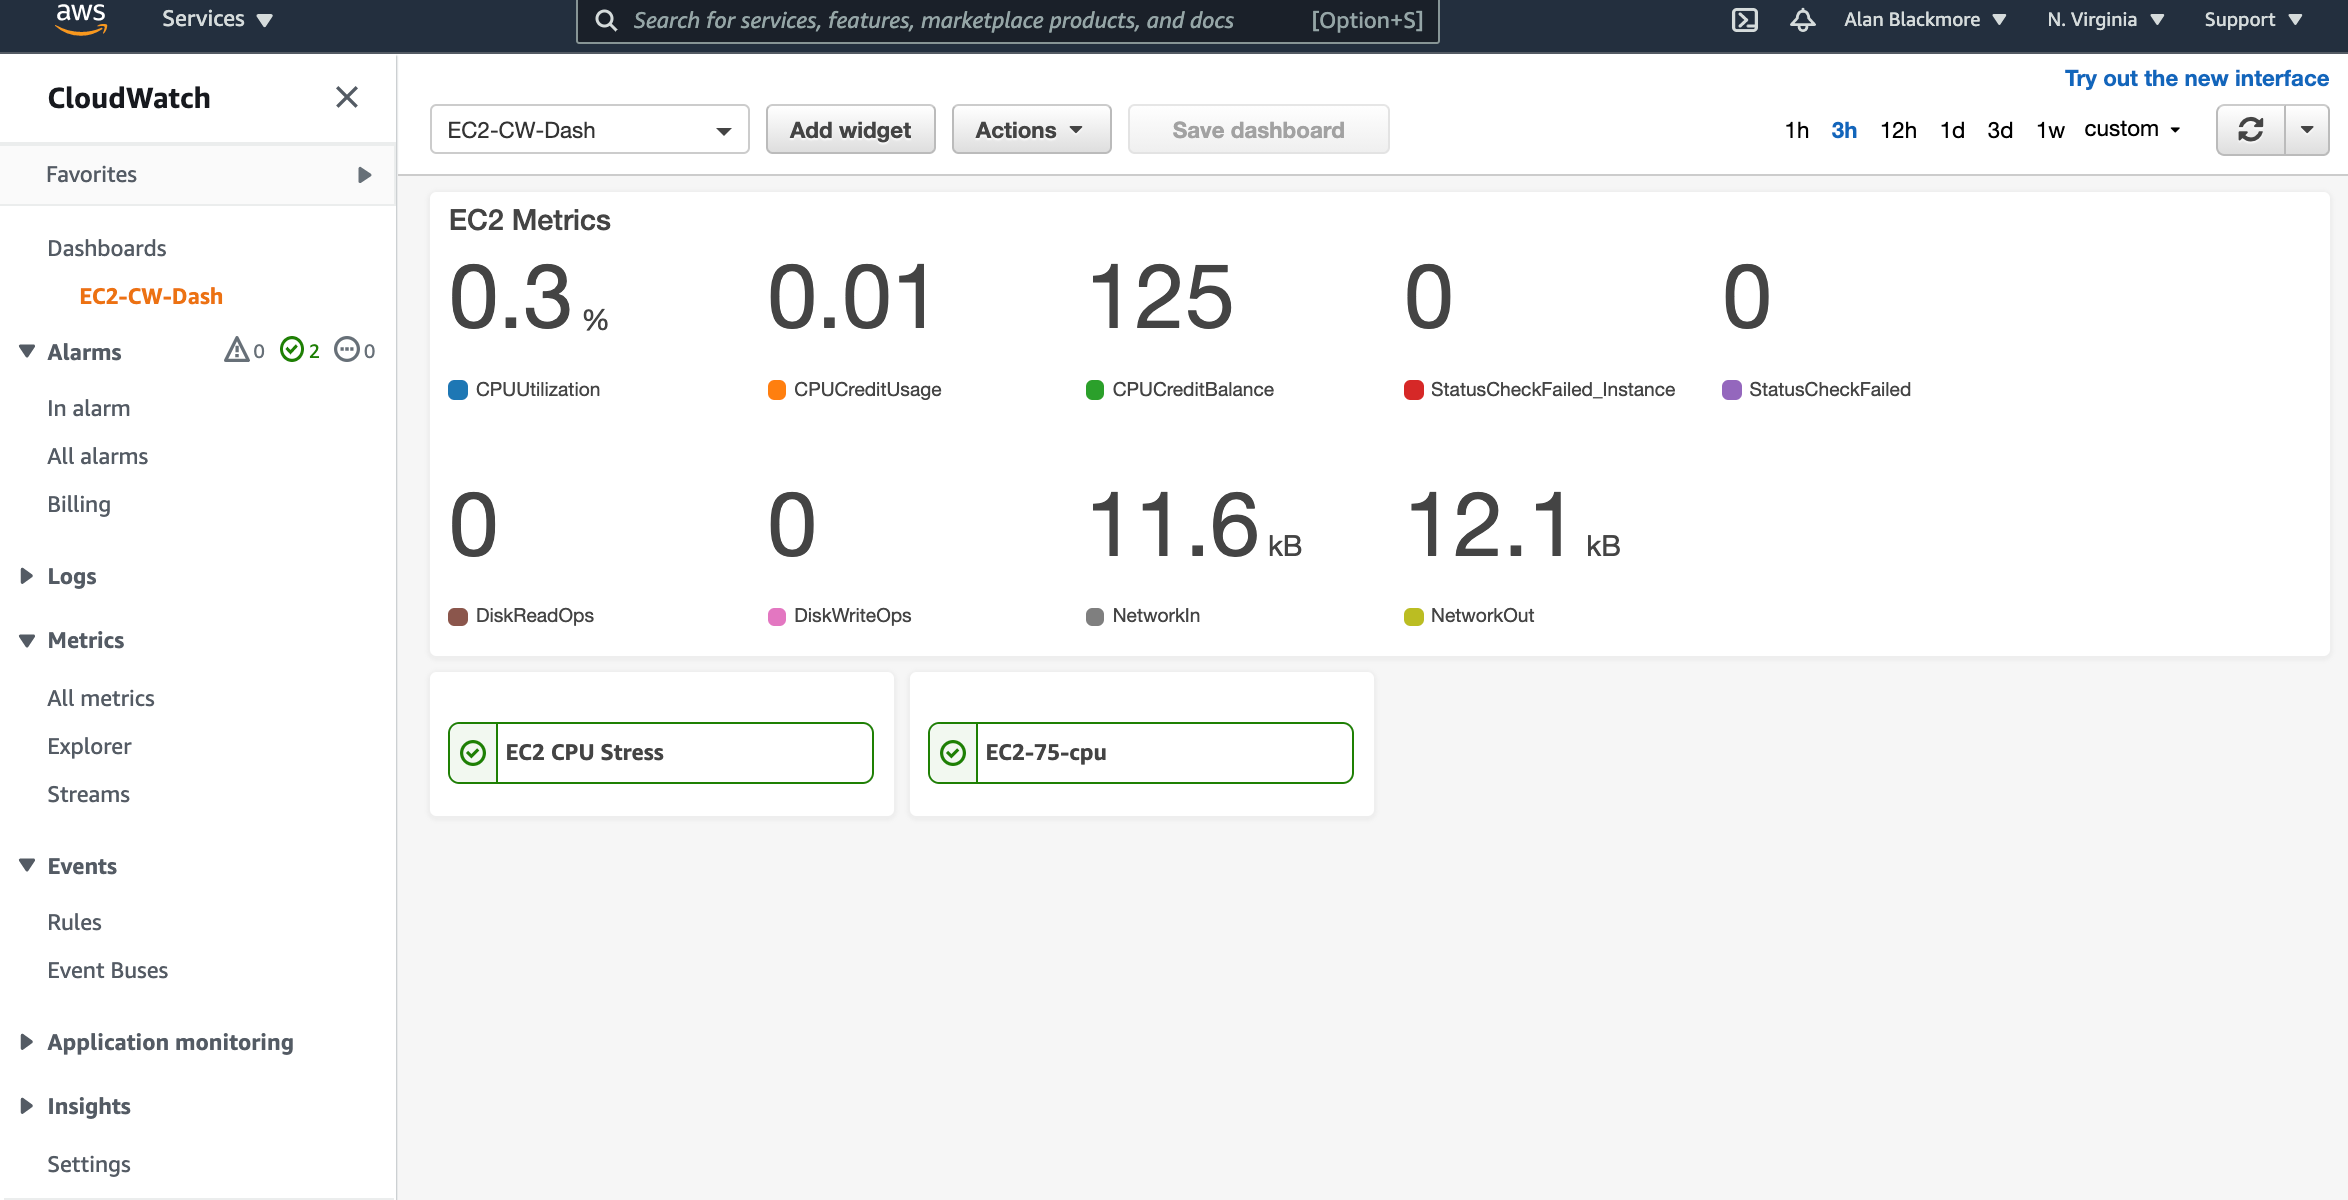
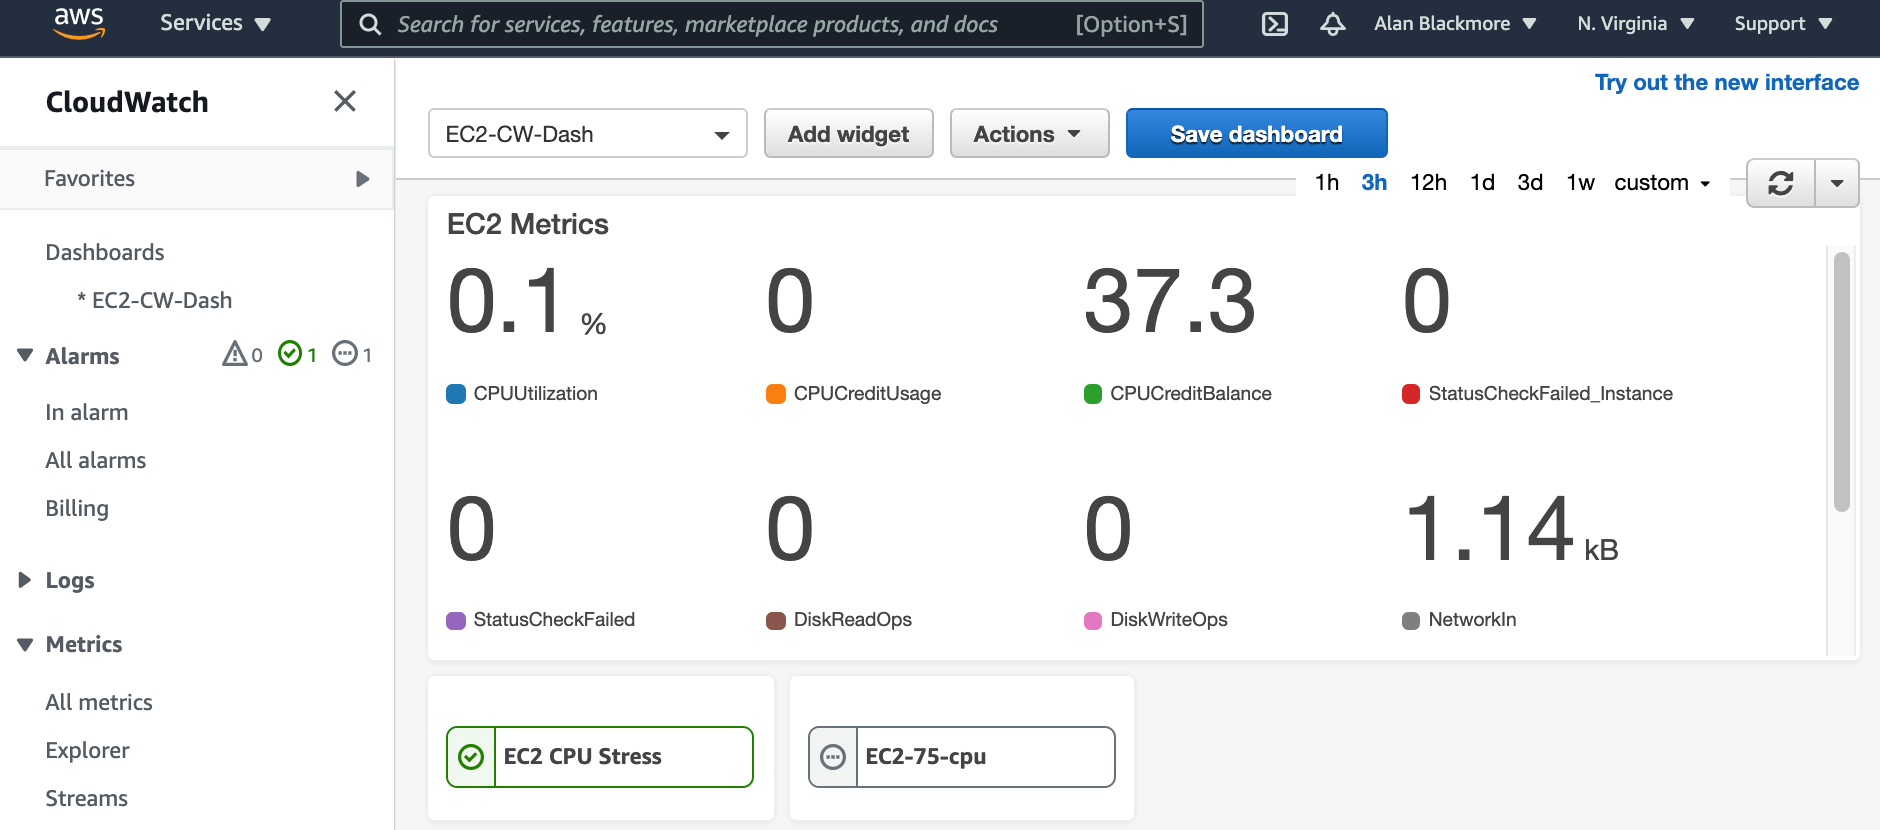
Add any more widgets you would like, then save the dashboard. In this example I’ve added an alarms widget.
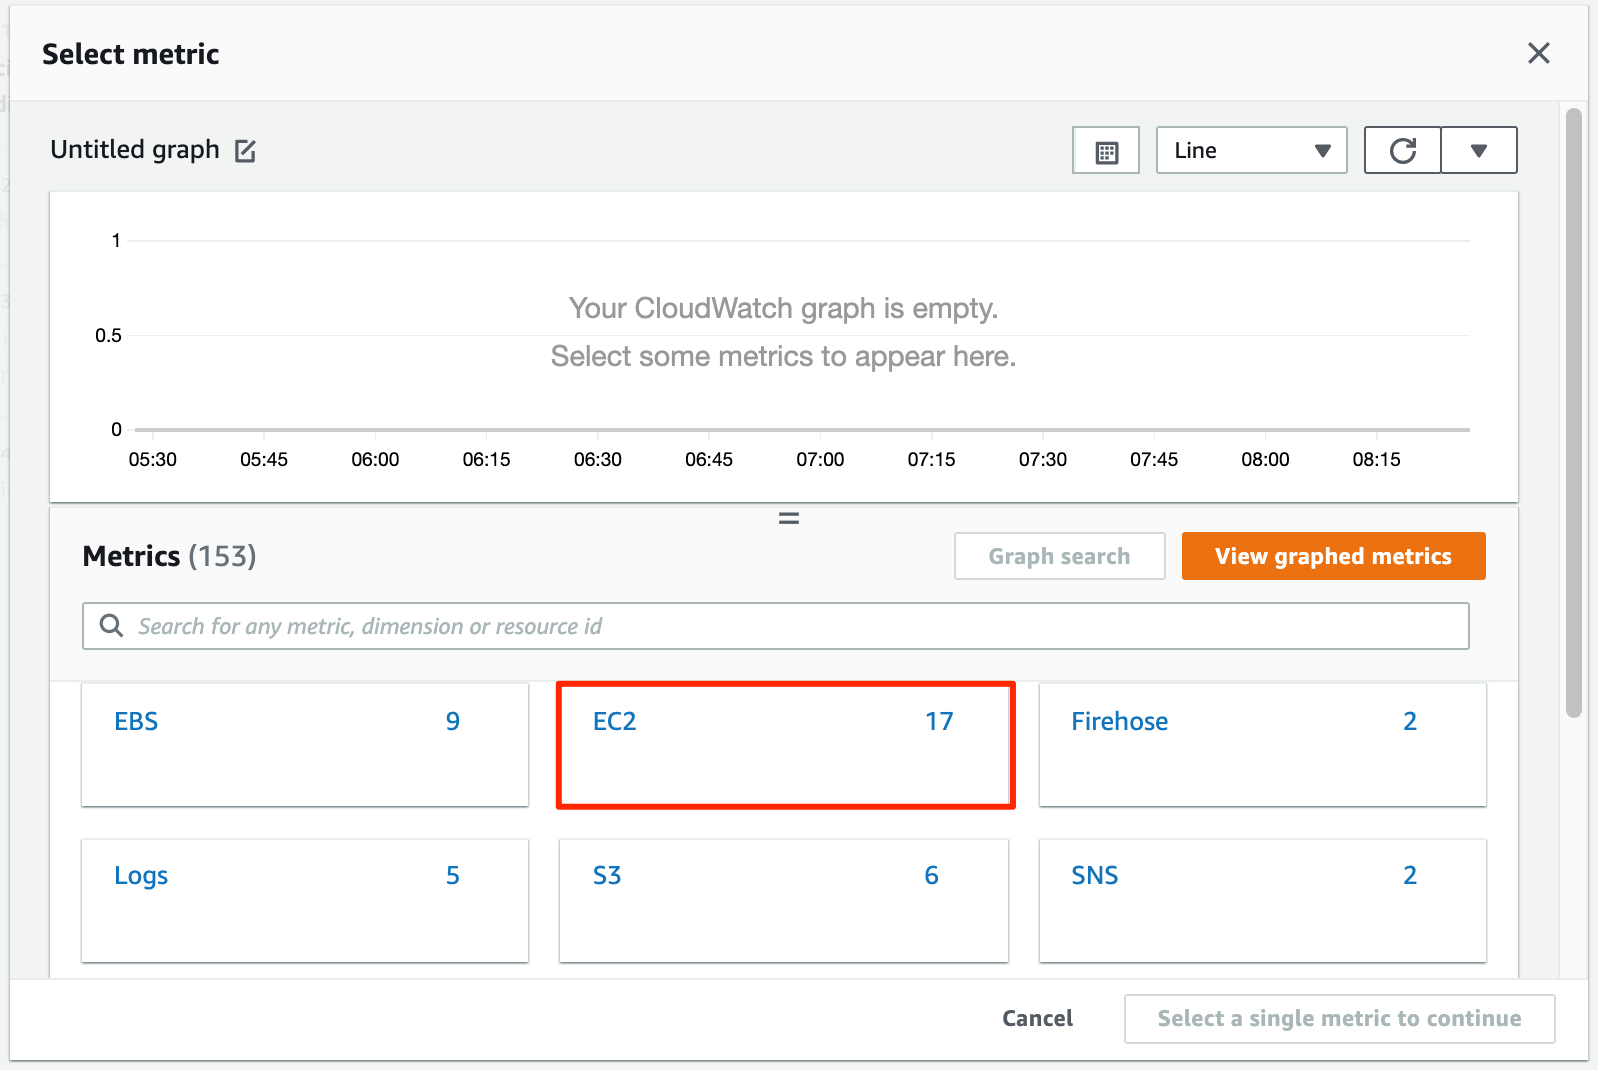
To add an alarm, open “All Alarms” from the sidebar menu and select create alarm and select metric. In this example, we’ll set an alarm when an EC2 InstanceCPU Utilisation exceeds 75%
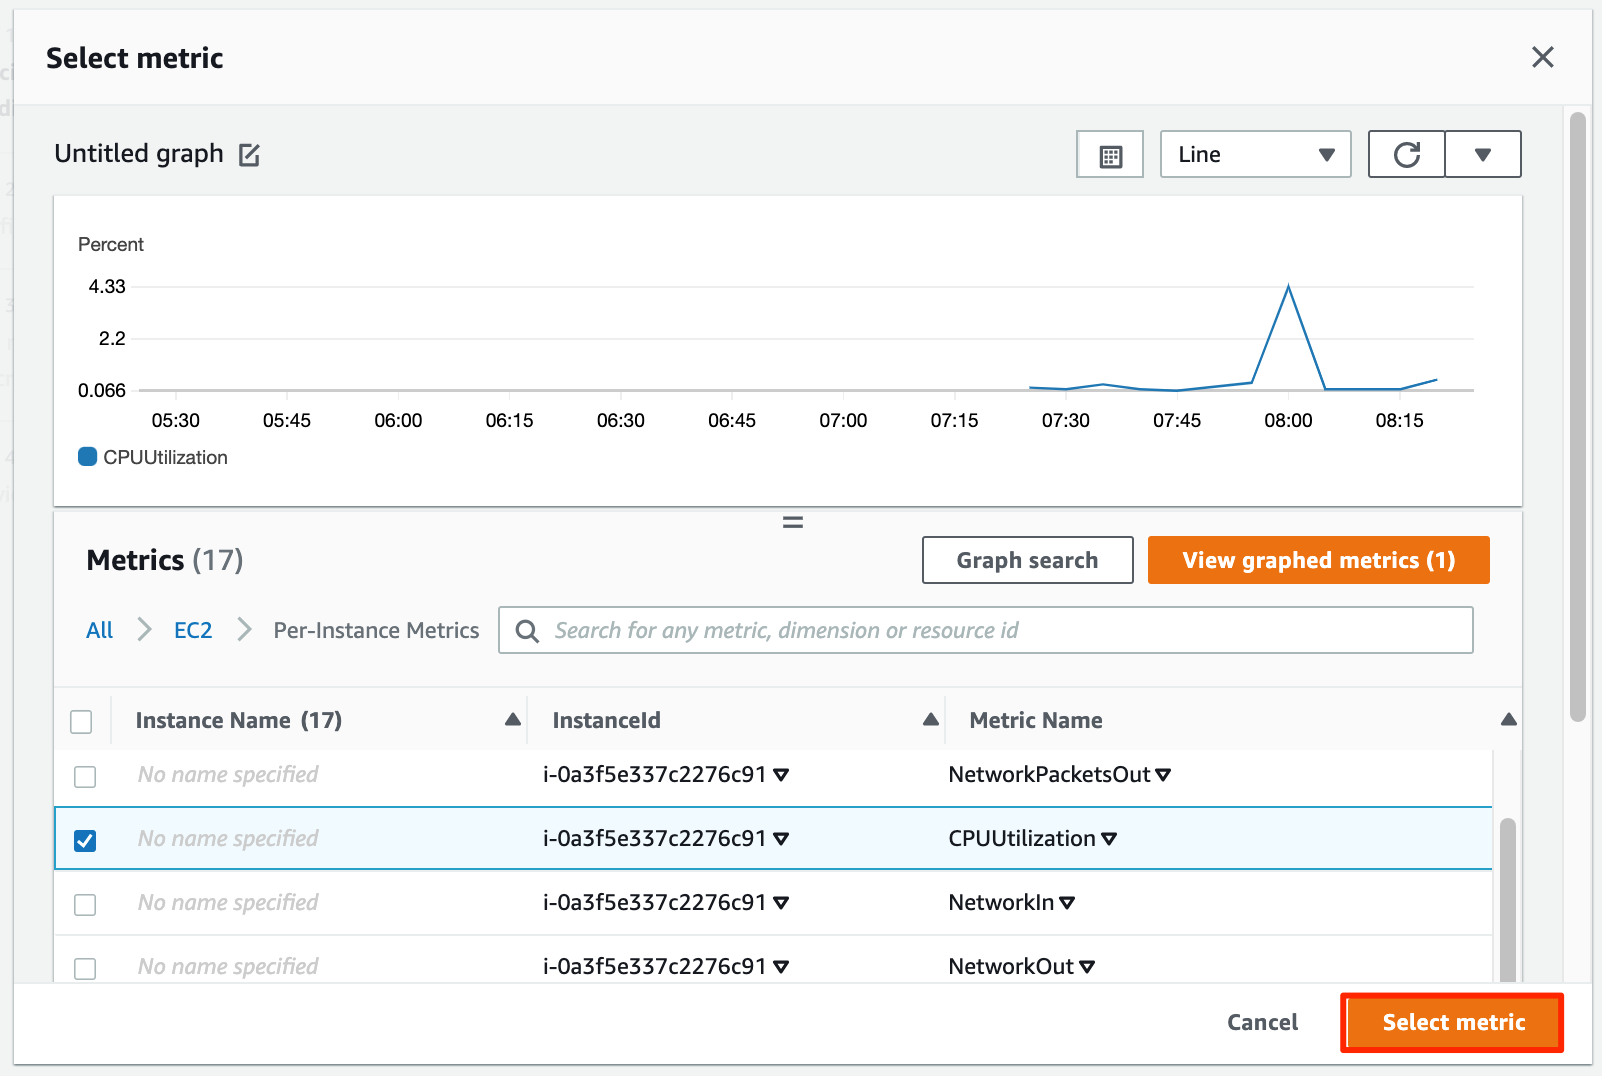
Select the required metric (in this case CPUUtilization)
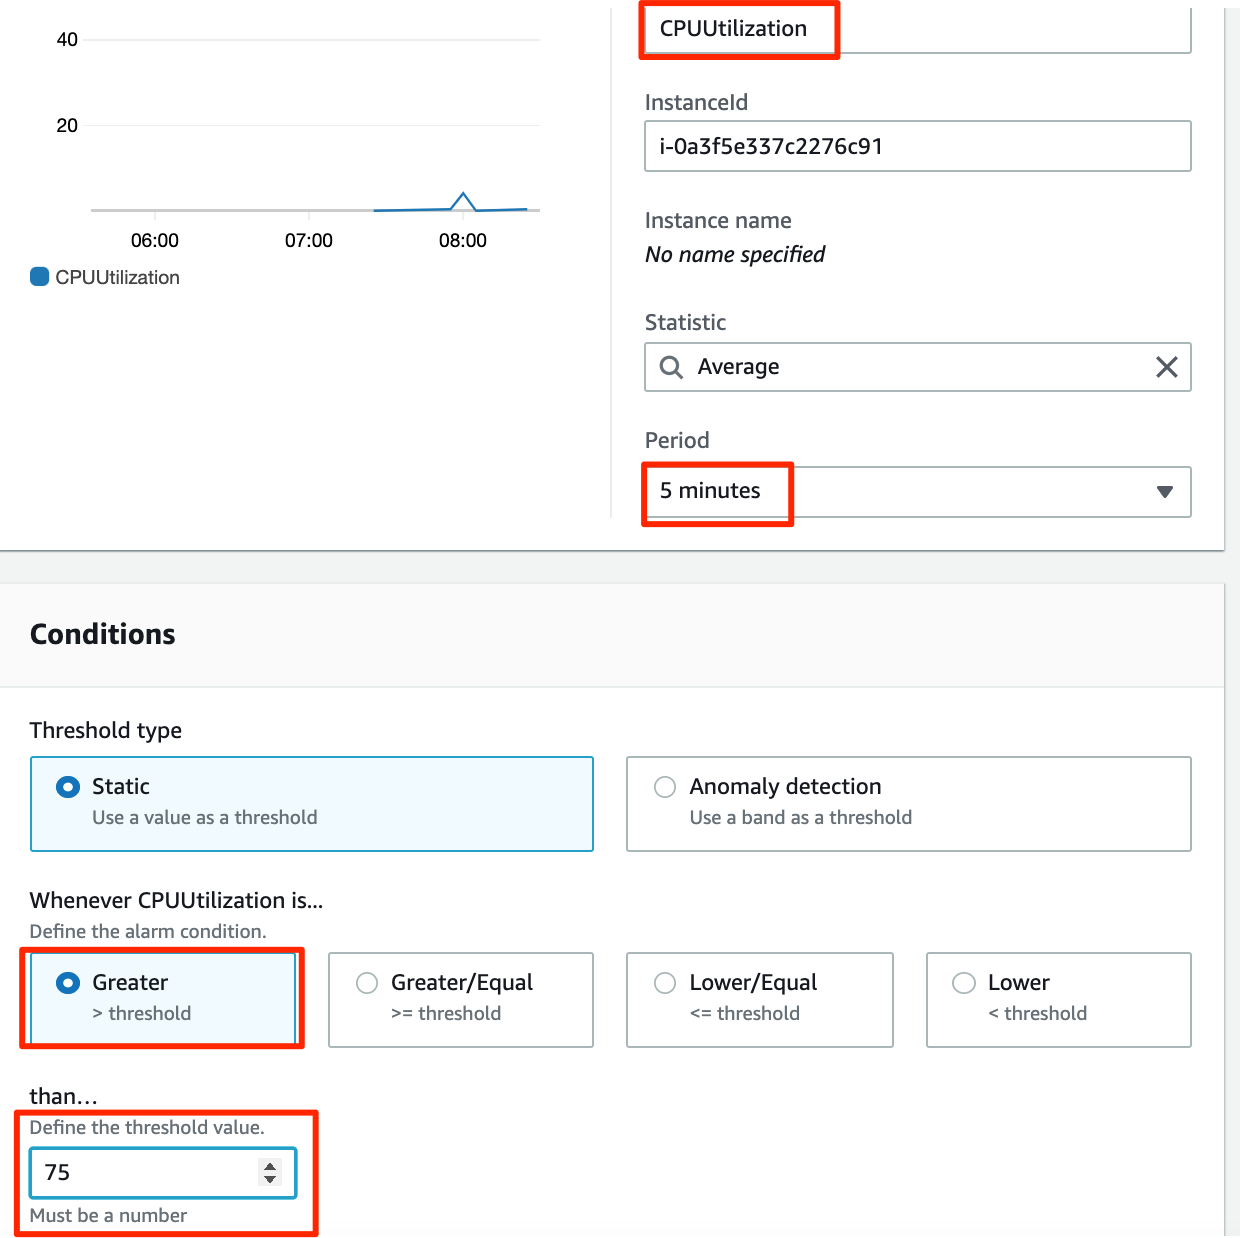
We can then specify what the trigger is by defining a time period that needs to be exceeded for the alarm to be triggered, and also the value the metric must be higher or lower than. In this case we’ll set the time period to the default 5 minutes and use the greater than qualifier with the threshold value set at 75.
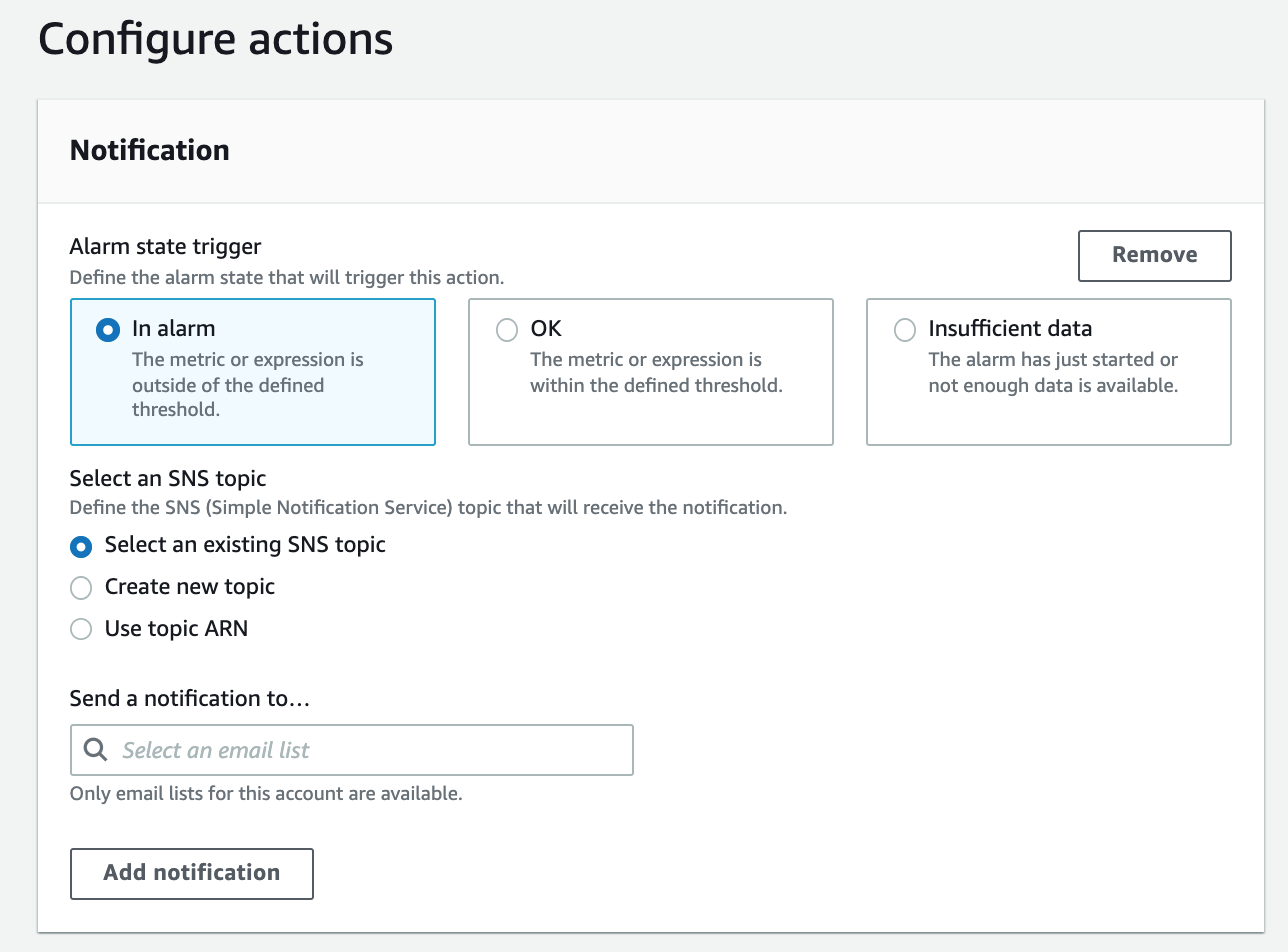
Now you can choose how to get notified based on the alarm. Typically you would send a notification when the alarm is triggered, although you can also send a notification when the alarm status is OK, or there is insufficient data.
Then you can select an existing SNS topic, or create a new one and specify an email address to receive notifications from the new SNS topic. Subsequently you should subscribe other people to the topic if you want them to receive the notifications as well.
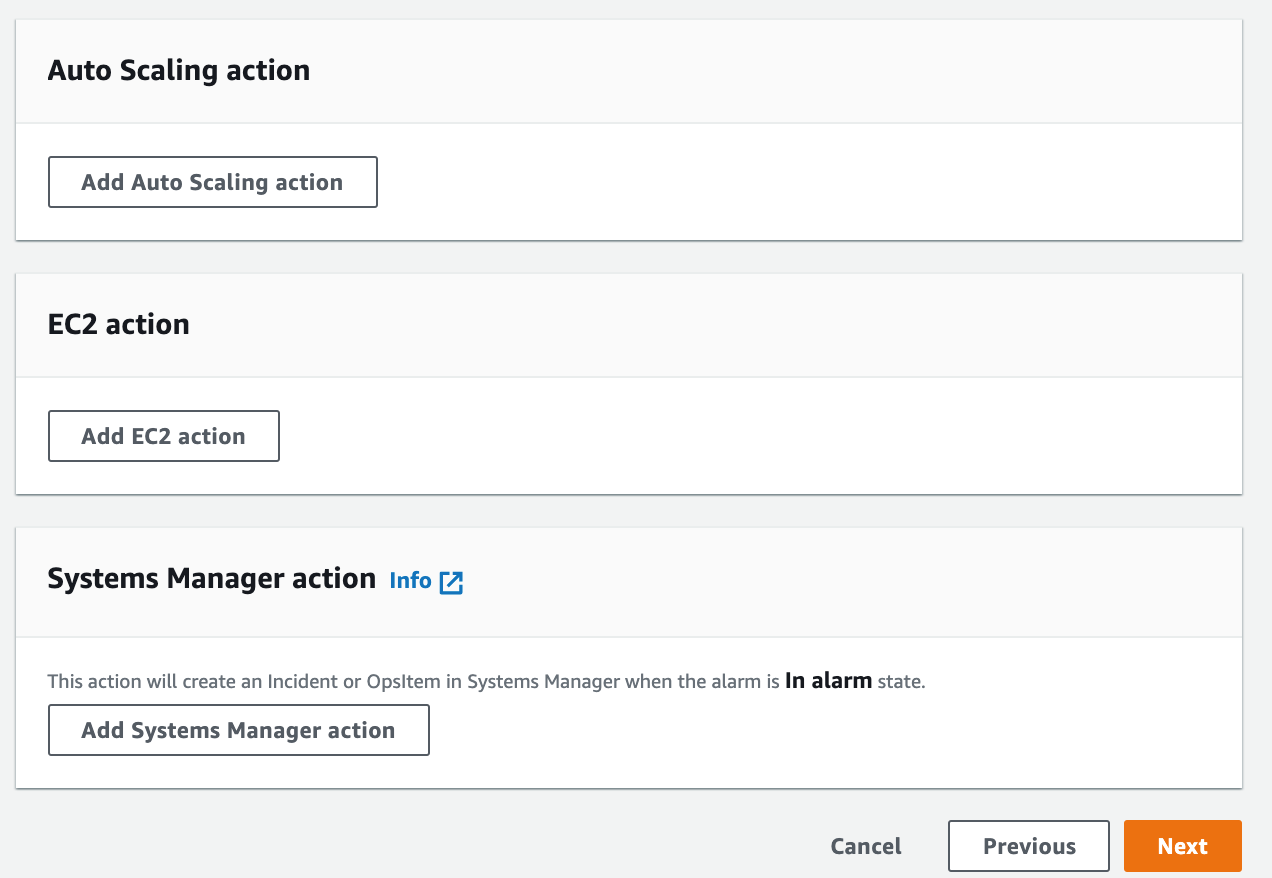
You may also trigger an auto scaling action at this point or an EC2 action and create a systems manager action.
A popular use case for this example would be to monitor the cpu utilization and should there be extended load on the ec2 instance CPU, you could trigger autoscaling to add more Ec2 instances attached to a load balancer to increase processing capacity for your application.
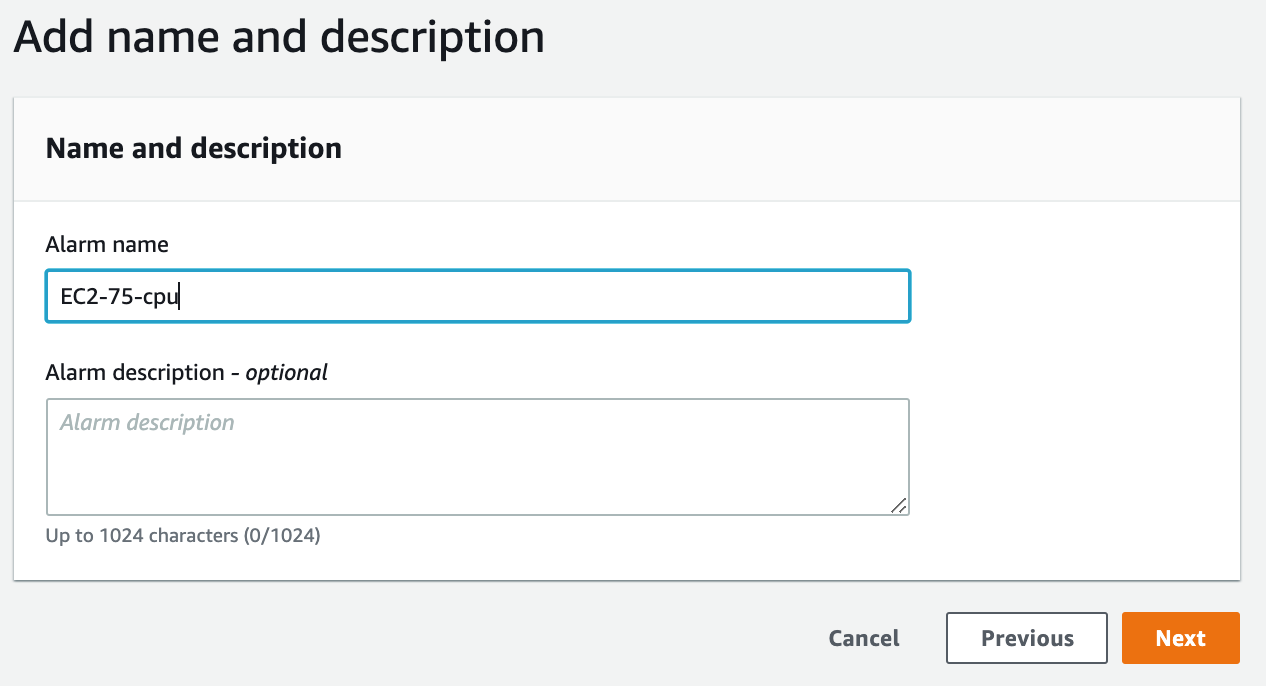
You can now name the alarm and optionally add it to one of your cloudwatch dashboards.
Cloudwatch Events is now referred to as Amazon EventBridge.
You can still create the Cloudwatch event by creating a new rule from the events/rules in the sidebar menu.
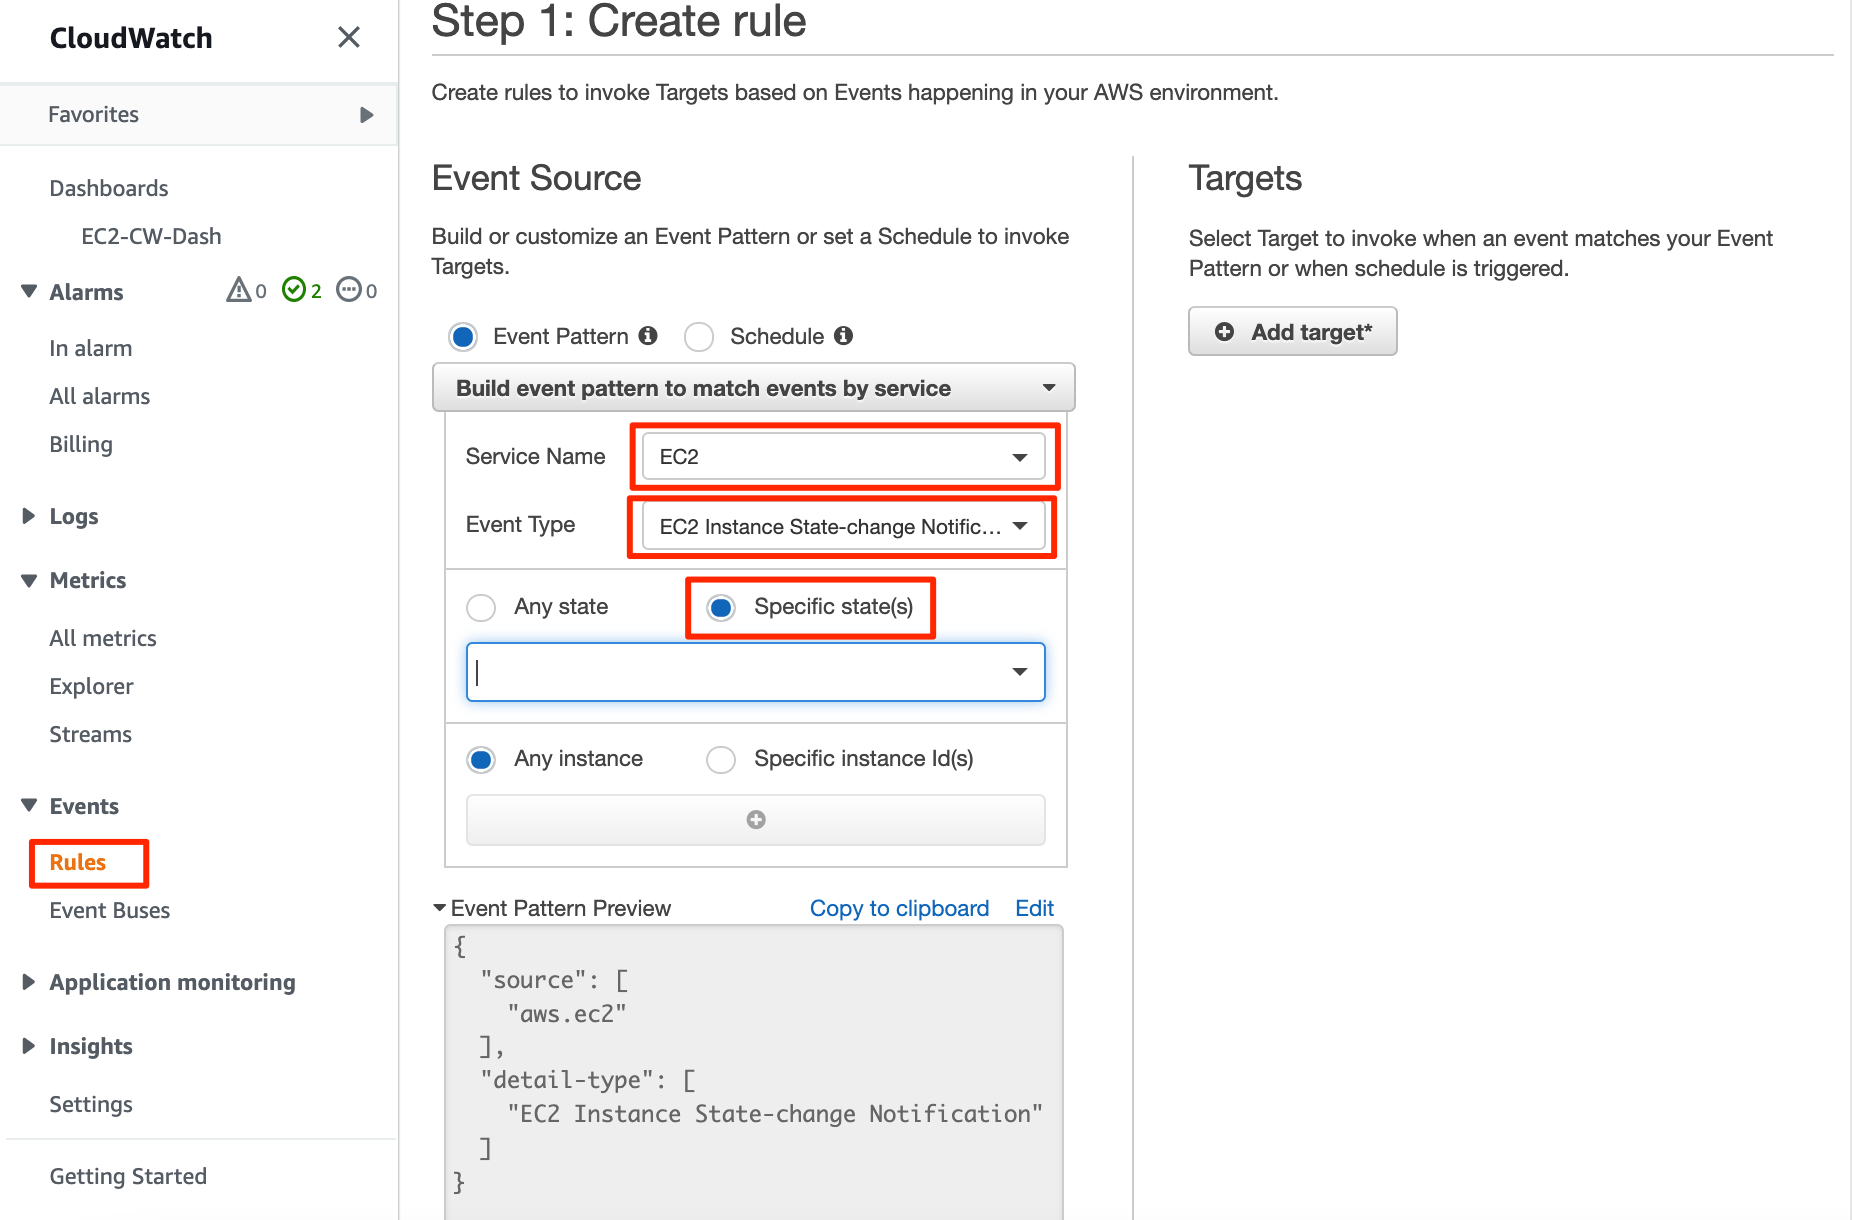
When creating the new rule, you specify whether an event pattern (like a state change) will trigger the event action, or you can specify a schedule to perform the action.
In this example, we’ll use an event pattern, then we’ll select “EC2” as the service to monitor and set the event type to “EC2 Instance State-change”
We can then say whether to trigger on “Any State” change or a specific state being
We can also specify if the event applies to all instances, or we can select a specific EC2 instance.
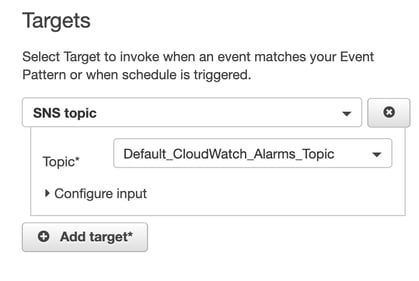
Once the event source is fully defined we need to add a target action.
This can be :
In this example, we’ll stick with a theme and fire an SNS Topic to send a notification via email.
The next step is to name and create the rule.
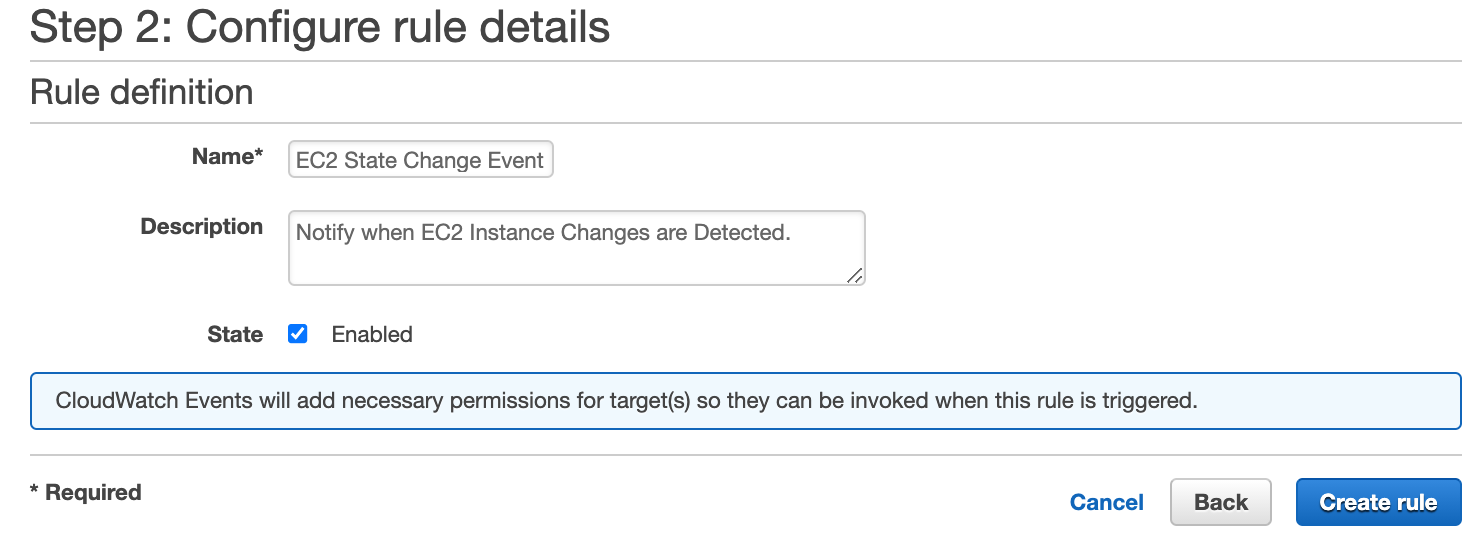
Now the event is created and running and will trigger whenever a state change is detected in any EC2 instance in the account the rule is running.
So that’s a quick run through Amazon Cloudwatch and the key elements that you can use to monitor and automate responses to events and state changes within you AWS infrastructure.
Talking of automation, if you are building network infrastructure on AWS and are not using Hava to automate your network topology diagrams and security visualization, we invite you to try Hava for free today,
just follow the button below to learn more.
If you are running cloud architecture on AWS, Azure or GCP you can benefit from dynamic cloud diagrams generated with Hava.
If you are running workloads on AWS, Azure or GCP you can benefit from fully automating your cloud diagrams freeing your cloud engineers for much...
If you are running cloud architecture on AWS, Azure or GCP you can benefit from fully automating your cloud diagrams with Hava.