aws
The Power of Automated Cloud Diagrams: Boost Productivity & Save Time
If you are running workloads on AWS, Azure or GCP you can benefit from fully automating your cloud diagrams freeing your cloud engineers for much...
There comes a point in every cloud project where a redesign of the infrastructure is required. It might be for performance reasons, to make the environment more resilient and highly available, or it might be to take advantage of new resources or methodologies that will improve your application's performance and make it easier to maintain.
Whatever the case, there is work to be done.
In this post we are going to discuss how you can fast-track the redesign process.
Taking an existing cloud based project and analysing exactly what is running is the crucial first step in creating a plan. You need to know what is running and what is required so you can explain to stakeholders why the redesign is necessary. This can be an excruciating process that is often skimmed over because of the time and effort involved.
When you can't see the entire picture, it's easy for things to get missed which can lead to mistakes and a potentially disastrous migration no matter how many days or weeks you spent in the cloud consoles mapping out resources onto a diagram.
There is a better way.
When you take on infrastructure for an internal project or a new client and are tasked with redesigning the supporting infrastructure on the same cloud platform there are a number of things you can do to fast-track understanding the state of play and ensuring the redesign was deployed as expected.
Your cloud account is the ultimate source of truth. Despite all your documentation, cmdb and historical design plans, what is actually running right now, this minute is reality.
Whether that's in AWS, Azure, GCP or combinations of all three, actual provisioned and running resources are your starting point. It doesn't really matter what people think should be there or what the ancient parchments decree, what's running now trumps everything else.
The easiest and fastest way to establish what you have running is to connect your cloud account to Hava and generate real-time interactive diagrams that show your exactly what you have running.
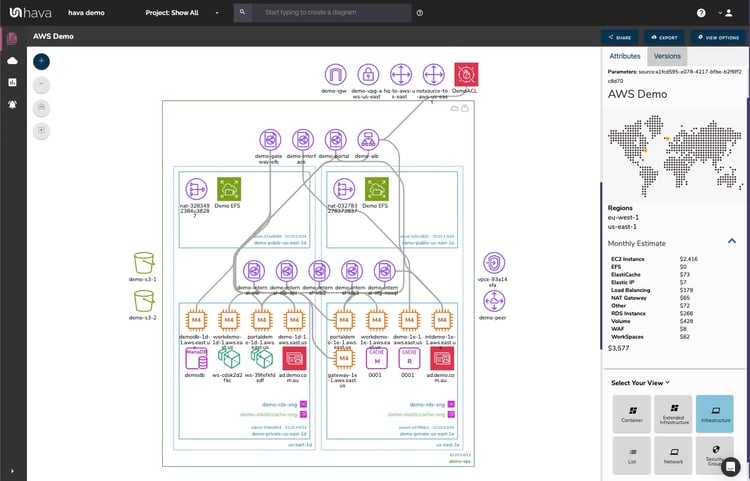
Hava scans your cloud provider account configuration and builds diagrams for each VPC or Virtual Network automatically. So you get to see exactly what is running where.
At the time of writing, AWS, Microsoft Azure and Google Cloud are supported. You can also visualize container workloads with views detailing workloads, pods and tasks available for the three supported cloud vendors and also stand alone Kubernetes clusters.
This is probably the fastest most efficient way of getting line-of-sight to all the running resources in your cloud infrastructure. Especially if you have just taken on a new client or project
When you take on a redesign project for a client or internally for an existing or new project, the very first thing you need is a baseline. A reference point that indicates what you have to work with.
Now back in the day, the core team at Hava were living that truth on a day to day basis. As a busy cloud consultancy we were taking on new client environments all the time.
The very first question we asked was "what does the infrastructure look like?". Rarely did the new clients have up to date or detailed documentation of what they had running, and in particular they had nothing in easily understood diagram form.
So we would need to grab a whiteboard and console credentials and start the painstaking process of mapping out the network.
I would take days, sometimes weeks to work through all the resources, separate those into virtual networks and then decipher how the security controlled access. Nightmare.
Nobody looked forward to that job, so we developed Hava to make it go away.
Hava does the job in seconds by scanning a connected cloud configuration and generating diagrams for each VPC discovered.
That saved our team of experienced engineers days and days of mind numbing intern level work.
Hava emerged as it's own business unit and eventually spun off to stand on it's own, which is why you have the opportunity to leverage the same smarts for your networks.
Once you know what resources you have running, what subnets they live in and what availability zones house the subnets you can start to make informed decisions about the robustness, redundancy and potential performance gains that can be made by making some changes.
The typical next steps are to start reflecting the desired changes on the base line diagram.
Now if you know Hava, you know you cannot edit the auto generated diagrams.
There are good reasons for this.
To be a reliable and auditable source of network details, Hava does not allow you to add or remove resources. What is shown on any Hava diagram at any point in time is a reflection of the true network state at that time. The live current diagram shows what is running now and the historical versions show what was running when that archived diagram was the live version.
There is however a mechanism for taking a Hava diagram as the baseline diagram for you to start making changes and applying redesign annotation. That is by exporting Hava diagrams in VSDX format and using Visio or a compatible application like draw.io to edit the diagram.
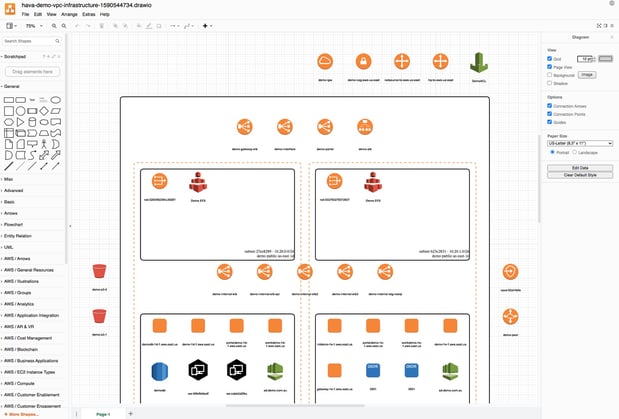
Each element of the Hava diagram becomes an object on the Visio diagram, so you can move them around, delete them and of course add new resources to the diagram to reflect the new network design.
When you have hundreds of resources, the time saving in just creating the base line diagram can be substantial. Time is money as they say.
So all is going well, you have generated your base line diagram, spotted several areas for improvement, refactored your application and IaC scripts and pushed the whole lot into production.
Did it work as expected? Did the production infrastructure repeat what happened in the test environment?
I guess you can wait for the support desk to light up, or maybe some validation ahead of that is a better strategy.
So we already discussed how Hava scans your cloud config to generate a diagram showing exactly what is running. You can use the same principle for validating infrastructure deployments.
In fact, if you already have Hava connected to your cloud account, this will happen automatically. The next auto sync will detect the changes and update the environment diagrams.
You can of course use the manual sync function or use the GitHub or Terraform integrations or the Hava API to trigger a sync and refresh the diagrams as part of the deployment pipeline.
That means as soon as you deploy, you can pull up the refreshed diagrams and make sure that everything is as you expected.
This does not just apply to infrastructure. There are other views within Hava like the AWS and Azure security view that can show you the security stance of your newly deployed infrastructure.
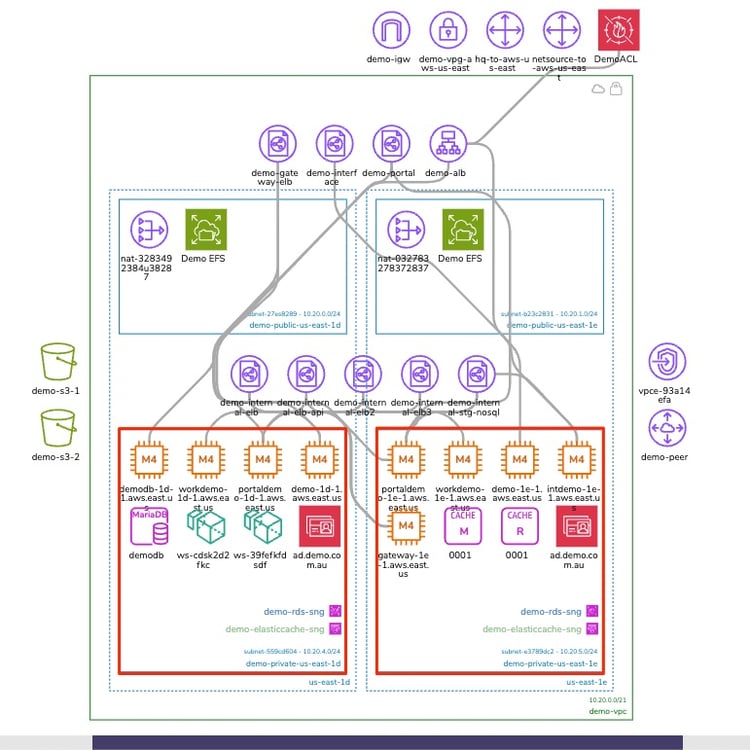
The Infrastructure view is a fully interactive diagram that show you your VPCs or Virtual Networks. Inside the VPC you have availability zones and subnets that show you what resources you have running and where they live.
The interactive nature of the Hava diagrams eludes to the ability to select individual diagram components which changes the attribute sidebar to display all the known metadata related to that resource. This means you don't have to keep flipping backwards and forwards through your cloud consoles to find out the information you need about a highlighted resource.
Another view is the Security View. This is entirely unique to Hava and shows you the security configuration for your AWS or Azure VPCs
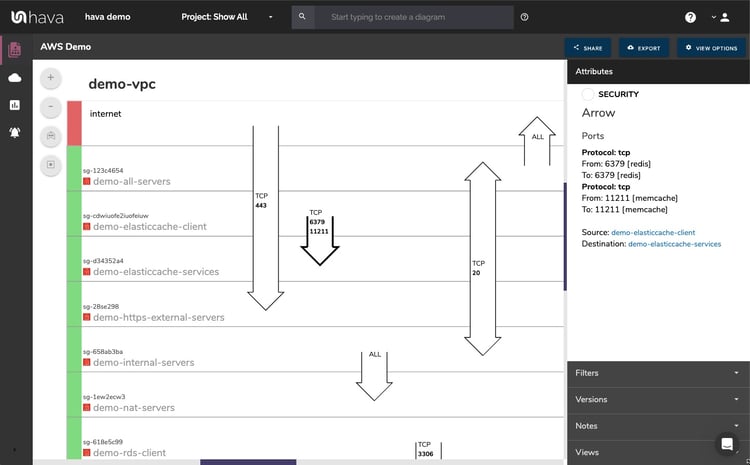
This view is also interactive and shows security groups horizontally with the open ports and protocols that allow traffic ingress/egress shown as arrows overlaid on the groups.
Selecting a security group on the diagram changes the attribute panel to show a ton of useful information including all the connected resource that security group controls.
If you are deploying containerised workloads on ECS EKS AKS GKE or stand alone Kubernetes clusters, you can leverage Hava's Container View to see the status of your pods or tasks in each cluster. While not as detailed as say the infrastructure view in AWS, you still get to see all your tasks and whether the run status is optimal or not.
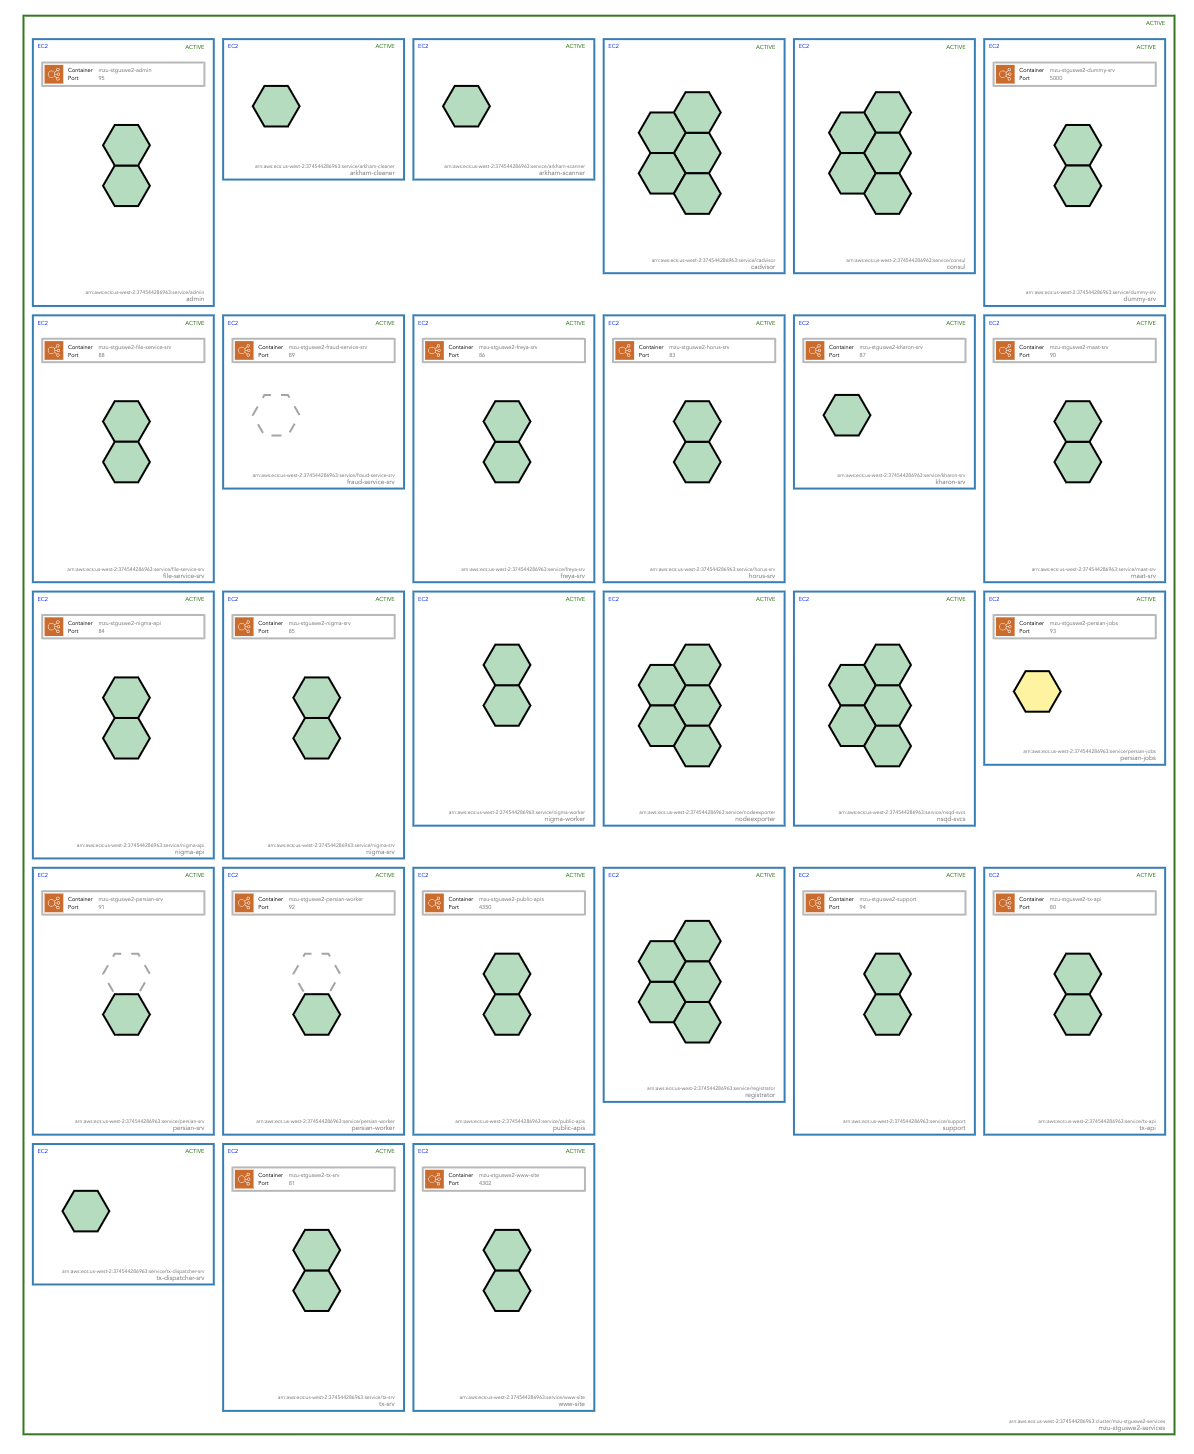
Post deployment of a redesigned workload, you can quickly review the status of your container tasks to ensure everything is running and continues to run as expected.
So that's a run down of the many ways you can use hava.io to fast-track the mechanics of redesigning cloud infrastructure and validating everything went according to plan.

If you are not currently using Hava to streamline and automate your cloud diagramming and documentation you can use the button below to grab a free 14 day trial of the fully featured Teams plan. You can also use it to see what unexpected resources you have running in your cloud accounts, you might be in for a surprise.

If you are running workloads on AWS, Azure or GCP you can benefit from fully automating your cloud diagrams freeing your cloud engineers for much...
What's the best automated tool for generating cloud infrastructure diagrams in 2023? If you are building on AWS, Azure, GCP, Kubernetes or all four,...
AWS Skill Builder is a repository of hundreds of free digital training courses to build your AWS cloud skills. In addition you can access labs, cloud...