Documentation
GCP Architecture Diagrams by Hava
GCP Architecture diagrams are essential for well-managed cloud infrastructure. Automation is the key to accurate Google Cloud diagrams that don't...
There is no question that keeping accurate Google Cloud Diagrams is essential for well managed and easily communicated GCP network infrastructure.
Maintaining up to date Google Cloud Platform diagrams allows you to easily understand the design and operation of your Google Cloud architecture and gives you the ability communicate your network design at all levels of your organisation, whether that's .
There are a number of things to consider when deciding to document your Google Cloud architecture like whether to manually construct diagrams or automate the process. In this post, we will take a look at what to consider and more specifically hava.io's approach to these considerations.
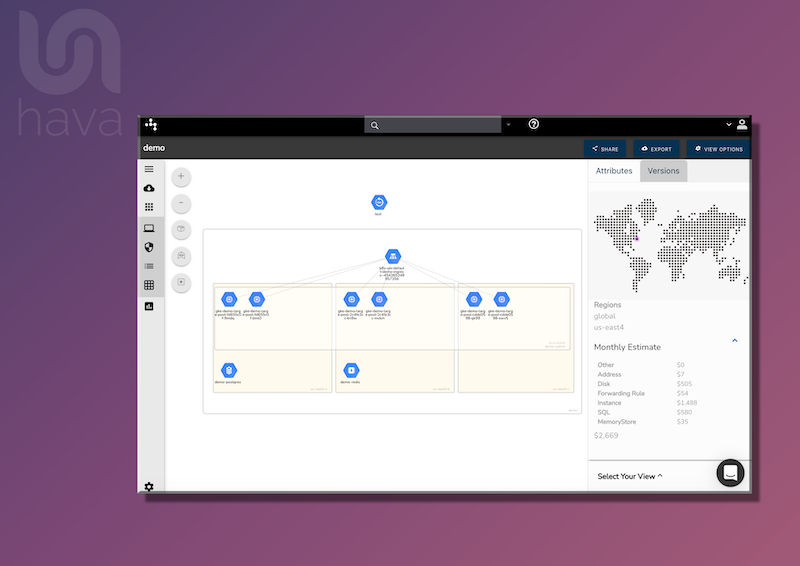
Clear concise Google Cloud Diagrams will typically be laid out by environment (cloud account) as the containing canvas which in turn displays your GCP network, the underlying availability zones and subnets.
Having your network topology laid out in this format shows you what zones you have configured and what GCP resources have been provisioned in each zone. This is particularly useful when designing in redundancy to your network. What happens to your application if any one of the zones has an outage. Will your application survive the outage?
The major downside to manually creating GCP network topology diagrams is the massive amount of tedious effort involved. Constantly swapping backwards and forwards from your drawing application to your console to establish what resources are there and how they are configured is both time consuming and susceptible to error.
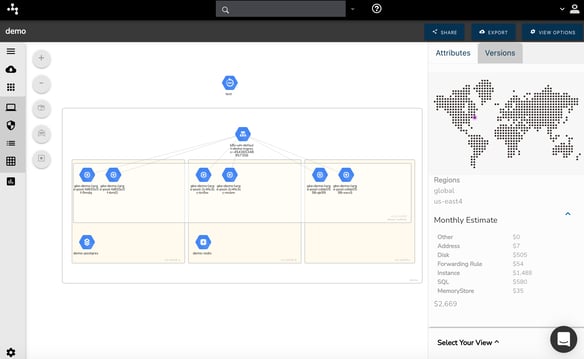
The way Hava approaches this challenge is automation. There is a danger of course that your diagrams could get flooded with too much information when automating which results in an unreadable diagram.
Instead of trying to fit all the known data-points for each resource onto the diagram, Hava diagrams are interactive. If you want to deep dive into the configuration of a visualized resource, you simply click on it and the attribute pane to the right hand side of the diagram changes to reveal contextual metadata relating to the selected resource.
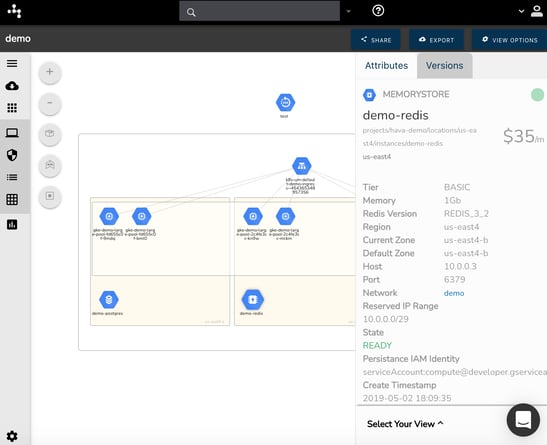
Selecting the demo-redis memory store icon on the above diagram changes the attribute pane on the right hand side to show all the known data relating to the memory store.
The result of this approach is that all the critical data you might need is one click away without having to leave the diagram. The diagram remains clean, uncluttered and easy to read.
Keeping your Google Cloud diagrams up to date is incredibly tedious and is an often overlooked task we all mean to get around to doing after making config changes, but rarely do.
The solution is to automate the process. Whether you are changing your network manually, deploying infrastructure as code or have autoscaling in place, keeping tabs on your network and updating diagrams as changes happen is the only way to ensure you always have up to date diagrams on hand.
Just like Hava automatically generates your diagrams when you connect a data source, it also keeps your Google Cloud diagrams up to date by continuously polling your configuration settings and producing a new diagram set when environment changes are detected.
That said, there can be a downside to this automation. If a number of consecutive config changes are made, then there is a danger that the previous working network design will be lost if you don't make copies of the diagrams. Having diagrams of the last stable configuration is essential when diagnosing outages or identifying critical resources that have gone offline or have been inadvertently modified or deleted. Capturing the changes via versioning instead of simply overwriting the live diagrams solves this problem.
It is useful to have an audit trial of consecutive configuration changes to enable you to track back between network designs to see what changed and why things deteriorated or improved due to the changes.
Hava's approach to this challenge is to automatically update your diagrams as changes are detected, but ALSO place the superseded diagram sets INDIVIDUALLY into a version history.
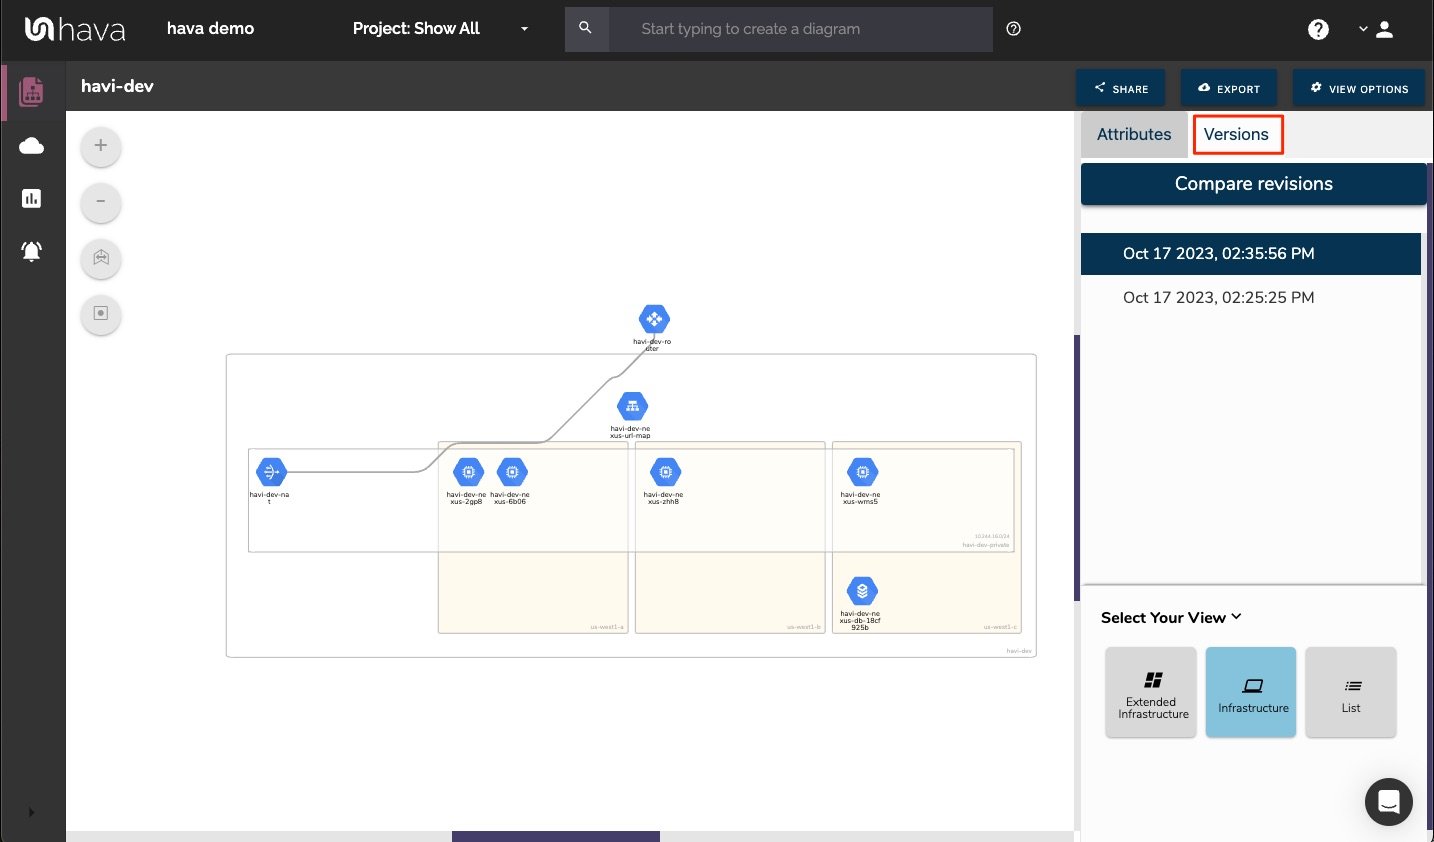
These "Versions" are a complete diagram set that is fully interactive, meaning you can open up an older version, click around the diagram, pull up resources and metadata as it was configured at the time the version was captured. So not only do you have the current network infrastructure always available in detail, you can also step back through iterations to find out what has changed over time.
You can use Hava's revision comparison or "Diff" View to visually compare the differences between any two current or historical diagrams.
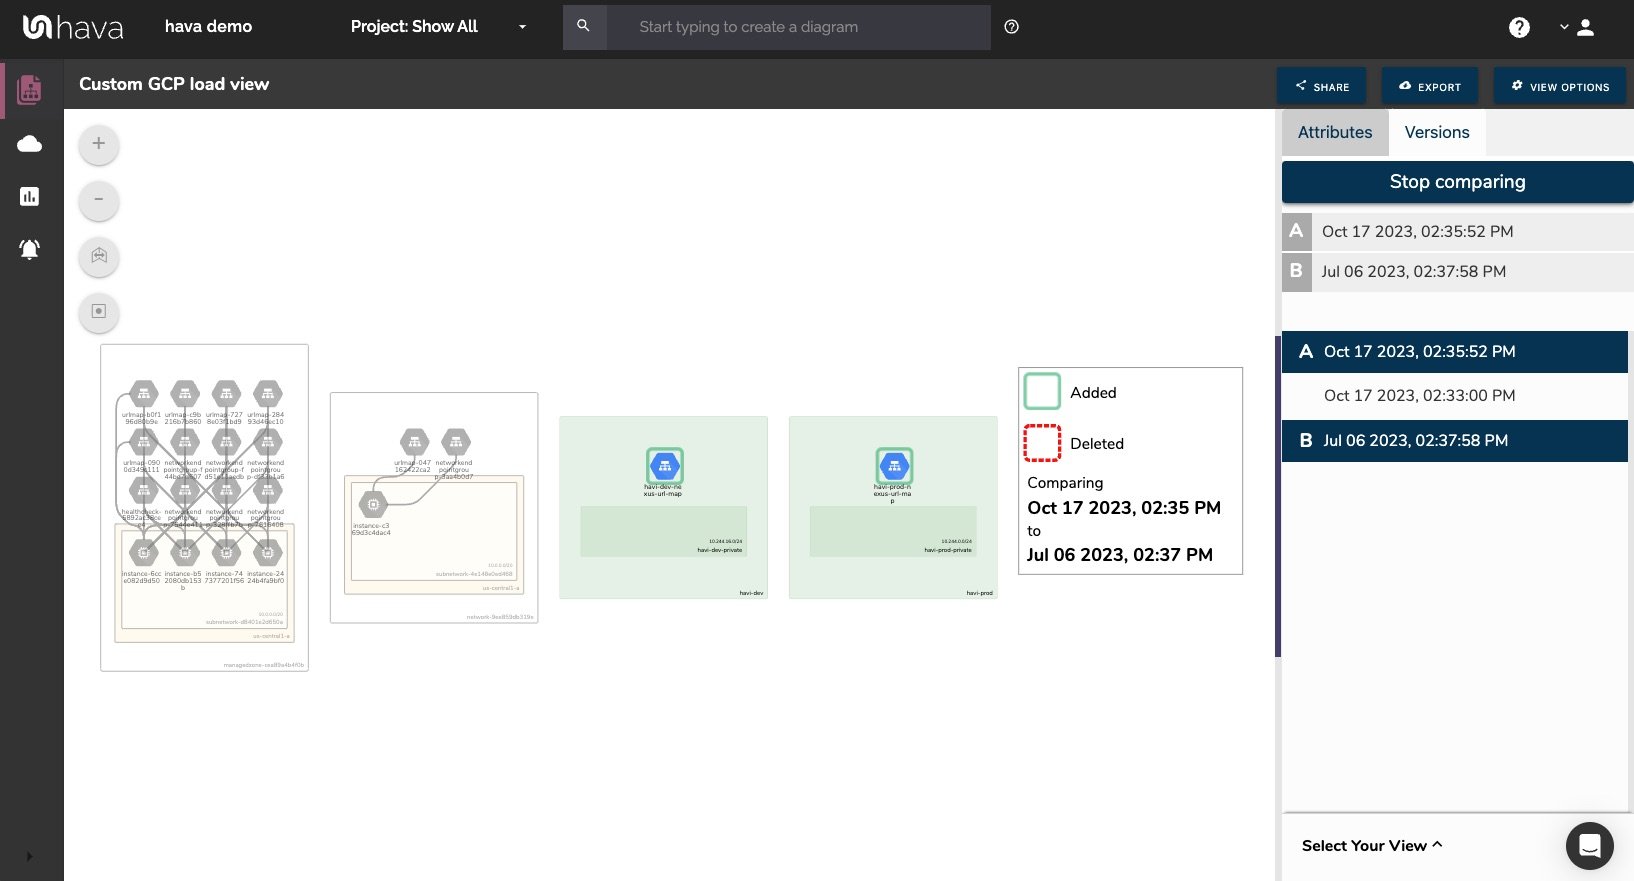
From a cloud engineering perspective, especially for your existing Google Cloud infrastructure, the native Hava diagrams should have everything you need.
There are however, some good reasons to export your Google Cloud diagrams.
Offline Storage. You may have compliance or internal policy requirements to keep your network documentation in hard copy or stored separately.
Presentations. You need a JPG or PNG of existing infrastructure for inclusion into a presentation or proposal.
Editing. Hava has built it's reputation on accuracy. The diagrams generated and stored within the application reflect what actually exists in your cloud environment. The diagrams produced by Hava can be relied upon as they are generated from the source of truth and cannot be manipulated.
Sometimes however, being able to use your network diagrams as a starting point when designing improvements or making changes can be a time saver, so Hava provides the ability to export Visio VSDX file formats so you can edit the diagrams outside of Hava. If you don't use Visio, importing the VSDX files into draw.io or diagrams.net provides similar editing functionality.
Diffing & Comparisons. You may encounter a scenario where you need a granular comparison of resource settings between two diagram sets (versions). Exporting is available to both CSV and JSON to help with this.
Using Hava's automated diagram solution, your GCP configuration is scanned when you connect to it and discovered environments are used to generate your Google Cloud diagrams.
Sometimes you may only be interested in a subset of an environment, like an individual subnet, a certain type of resource or everything that is tagged with a specific value like "dev" or "prod"
In this situation Hava provides the ability to generate custom diagrams using a number of reserved search terms as well as customer generated tags meaning there is almost unlimited flexibility to create just the diagrams you need.
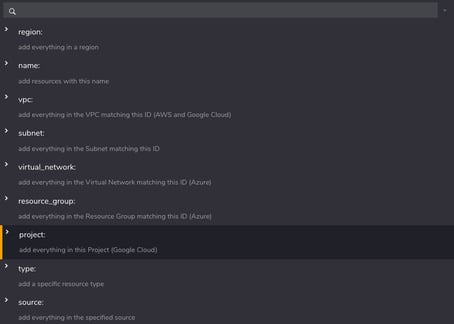
The reserved search parameters include multi platform terms like
As well as GCP Specific terms
You can also use user generated tags when defining custom diagrams. So for instance if you created a tag to identify whether a resource was related to a development or production environment it might look something like "Status:Production" or "Status:Dev".
The arbitrary "Status" tag could then be used to build diagrams that just show everything tagged with a status of "Dev"
Any search parameter entered that isn't in the list of reserved terms is treated as a tag.
You can execute these queries to build on-the-fly diagrams to view once. The typical use case is where you are trying to locate a specific resource that could be in any one of hundreds of environments.
If you want to store the custom diagram, then you have the ability to save it to your environment dashboard. Once you save the diagram, Hava will treat it like all other auto generated diagrams and continuously poll the components looking for changes. When changes are detected Hava automatically updates the custom diagrams and version history when changes are detected.
A typical use-case for saved custom diagrams are to isolate dev vs production environments onto separate diagrams, create single resource type diagrams, drawing data from multiple accounts onto one diagram (like databases for a DbAdmin) , or to create Hybrid cloud diagrams from multiple cloud vendors, like all dev environments across your company GCP, AWS and Azure accounts.
Hava discovers resources configured in your GCP account console. Depending on the resource, discovered components may or may not be visualised on your GCP infrastructure diagrams.
Items that are not visualised on your diagrams are available on the "List View" so you can still analyse and export a full list of everything discovered.
|
Resources Visualised |
|
|
Compute Backend Service |
|
|
External VPN Gateway |
|
|
Compute Instance |
|
|
Compute Interconnect |
|
|
Compute Nat Gateway |
|
|
Compute Network |
|
|
Compute Router |
|
|
Compute Subnetwork |
|
|
Compute URL Map |
|
|
VPN Gateway |
|
|
DNS Managed Zone |
|
|
Memory Store Instance |
|
|
SQL Instance |
|
|
Storage Bucket |
|
Imported resources not visualised on your automated interactive cloud infrastructure diagram will appear within the attributes tab and on the Hava List View
|
Non Visualised Resources |
|
Compute Address |
|
Compute Autoscaler |
|
Compute Backend Bucket |
|
Disk |
|
Firewall |
|
Forwarding Rule |
|
Forwarding Rule Targets |
|
Instance Group |
|
Interconnect Attachment |
|
Network Endpoint Group |
|
Node Group |
|
Route |
|
SSL Certificate |
|
SSL Policy |
|
VPN Tunnel |

If you would like to check out Hava Google Cloud diagrams, you can open a trial account and import a demo GCP environment to get familiar with the process here:

GCP Architecture diagrams are essential for well-managed cloud infrastructure. Automation is the key to accurate Google Cloud diagrams that don't...
Google Cloud Platform Architecture Diagrams are essential for well-managed GCP infrastructure. Automation is the key to accurate Google Cloud...
Google Cloud Diagrams are an essential tool for well-managed GCP infrastructure. Automation is the key to accurate and perpetually up to date Google...