aws
Custom Resource Connections | Enriching Auto Generated Cloud Diagrams
It is now possible to enrich your Hava auto generated cloud architecture diagrams with custom connections. This feature lets you connect any two...
A CTO needs a clear line of sight to the networks and network resources they are responsible for, especially if they that infrastructure is cloud based.
Whether you have a single virtual network or thousands of client networks under management, clear concise network infrastructure diagrams that are generated automatically will give you clarity over exactly what is running where.
Apart from the obvious time saving aspect of connecting a cloud account once and receiving diagrams for potentially hundreds of VPCs effortlessly, a major advantage for any CTO using hava.io is you get to see EXACTLY what is running.
Because the diagram process is hands free, there is no opportunity for confusion. There is no way to add resources to the diagram that don't actually exist, and there is no way to obfuscate running resources. You get to see exactly what your team have built, what resources are running, where they are running, how they are configured and in the case of AWS and Azure, what the security stance looks like.
As a CTO you are always keeping an eye on costs. Staff costs, resource and network costs, contractor and consultant costs and tech debt.
By connecting a new cloud account to Hava, you immediately eliminate the cost of labour to produce network diagrams. Your people are free to go do something else.
You also eliminate the cost of keeping those diagrams up to date. Hava monitors connected cloud data sources in the background, so when config changes are detected, new diagrams are automatically generated. No need to log in to Hava or trigger a sync manually. It all happens on autopilot.
When you take on a new client network or project, the hours or days spent establishing the state of play are eliminated, connect the cloud account to Hava and boom, the diagrams are built and you can see how it's built and what is running where.
When you engage expensive cloud consultants, you can provide them access to the accurate up to date diagrams you have in your Hava account and potentially save days or weeks of billing as they try to work out how your infrastructure hangs together.
Likewise with your staff, when you are onboarding new engineers, the first thing they will need to know (apart from the location of the coffee machine) is what your infrastructure looks like. In terms of comprehension, showing a new engineer a diagram will do in seconds what would take hours or possibly days scouring through cloud consoles.
Part of your role as CTO is to ensure systems are performant and to get your team to react quickly when something goes wrong. Knowing how a network looked when things were running ok vs what is running now can give you a massive head start in identifying the root cause of an issue or outage.
When you have hundreds of environments or cloud accounts under management, you aren't going to know off the top of your head what every single network should look like or what resources are missing.
When you connect a cloud account to Hava, once the initial scan is complete and diagrams have been generated, Hava starts periodically scanning your config looking for changes. Again this is all background processes, you don't need to log in to Hava to invoke anything.
Then when a change is detected a new diagram set is generated and the superseded diagram is placed in versioning.
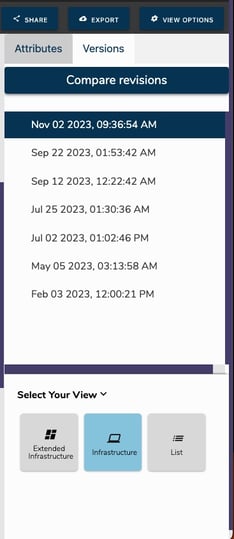
This means you effectively have an audit trail of network changes, one of which might be the root cause of a current system outage. All you need to do is place the current and historical network diagrams side by side and play spot-the-difference.
When you reduce costs to the organisation, your bosses will be reminded of why they hired you in the first place, it wasn't just for your good looks.
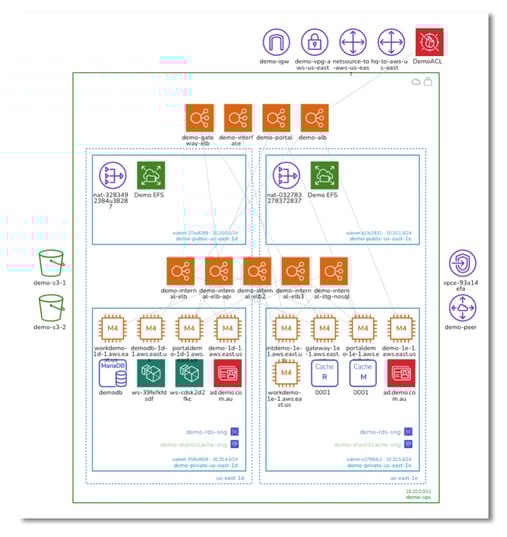
When you connect a cloud account to Hava it scans the console config and generates an infrastructure diagram for each VPC or virtual network discovered.
Sometimes the results are unexpected. You might surface entire development environments that haven't been used in years, or maybe isolated databases that were cloned that one time for analysis and never deleted. These can be costing your organisation significant amounts of cold hard cash but are buried so deep within your cloud provider bill that nobody notices.
Eliminate those unnecessary costs and there will be a gold star on your next report card. Eliminate those costs for a newly acquired client and they will remind themselves of the wise decision they made hiring you to look after their network.
Superstar CTOs keep their systems up and running 99.99999% of the time. They do this by anticipating the things that could go wrong and mitigating the risk.
When you look at a Hava infrastructure diagram, it is laid out in availability zone columns with each resource show in its respective subnet. Which means at a glance you can see what happens during an AZ outage, or if a single point of failure like a solitary network gateway fails.
You can visually appreciate the ramifications of failures. If an AZ has an outage, will your load balancers route traffic to an alternative compute instance. Does that instance still have access to your application data. Are you even replicating?
The CTO needs to have all these weak points and potential disasters covered, and by scanning a Hava infra diagram you can easily spot obvious weak points. When work is required you have the diagrams in front of you to explain to your team, management or clients exactly what needs to be deployed or reconfigured and why.
As a CTO security is a subject that probably keeps you up at night, especially if you are looking after hundreds of cloud accounts or large complex infrastructure.
On top of the worries of making sure all your underlying operating systems and applications are patched to the latest theoretically less vulnerable versions, one of the primary concerns will be how does traffic enter and traverse your network, what ports and protocols allow this to happen and what security policies are permitting access to your resources.
If you are building on AWS or Azure and have those accounts connected to Hava, you will have security view diagrams waiting for you in your Hava dashboard.
For each VPC discovered in AWS, Hava will generate a security view diagram for that VPC that details all the security groups and what each security group controls and allows access to:
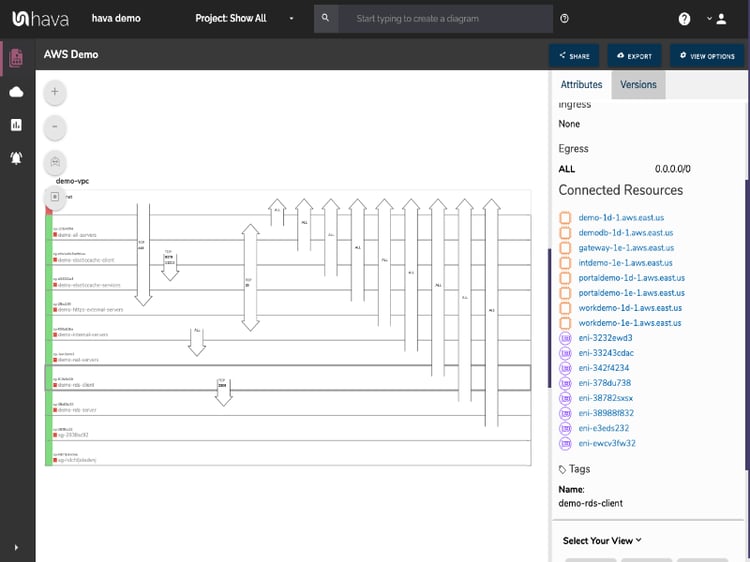
This view displays each security group and when you select a group all the known details about it are displayed like the ingress and egress ports and associated protocols along with all the resources associated with the group.
Then on top of the diagram canvas the ports allowing traffic movement are displayed. You can see at a glance what ports are open and where traffic goes.
Your security team will love this diagram.
On top of the use cases already discussed, Hava diagrams enable you to share infrastructure information with people in your organisation and with external interested parties, like auditors.
During a PCI audit for instance, you will need to demonstrate your security posture for which you can use the security view diagram, or the location of your data at rest which is displayed on the infrastructure diagrams. You may also be asked about what has changed since your last audit for which you have fully interactive historical diagrams sitting in versioning for comparison.
You can export Hava diagrams so you don't have to grant access to Hava in order to display a diagram. This can be by way of exported PDF, PNG or for technical analysis via CSV or JSON
Diagrams can also be placed outside of Hava using the embedded viewer. This lets you insert live interactive diagrams anywhere that supports iFrames. Viewers will be able to see diagrams with or without sensitive settings without being logged into Hava. This allows you show what you have built to other team members or clients providing the ultimate transparency.
Coders want to code. Why swap applications to document what you are deploying when you can add data sources and trigger sync requests directly in your deployment code.
Hava is API driven which your dev team has access to, so they can do all the major manual functions in Hava programatically, like adding a new data source, telling Hava to sync it and then to pull back the updated diagrams for archiving or inclusion in pipeline doco.
There are integrations with Terraform and GitHub to make this even easier.
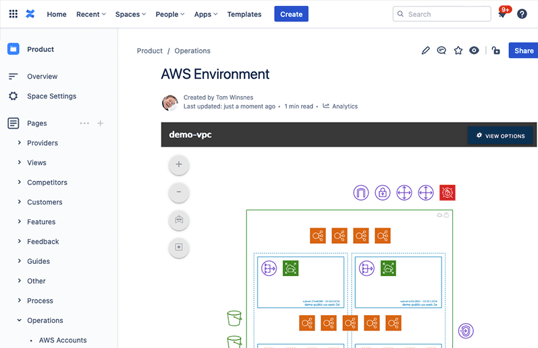
You can also use the Confluence plugin to easily embed live diagrams into your company Wiki.
The options are endless.
Hava supports AWS, Azure and GCP as cloud providers as well as stand alone Kubernetes clusters and can be run on your own cloud infrastructure (self-hosted) or can be accessed online (SaaS)
In summary, there are countless ways a CTO can benefit from adding Hava to their tool chest so they can deliver better infrastructure, reduce costs and provide transparency to both internal and external stakeholders.
You can find out more about Hava on our home page where you will find a video walkthrough, or you can contact us to arrange a 1 on 1 screen share demo to get your questions answered.

Alternatively you can take the fully featured teams plan for a 14 day free trial to assess if automated Hava diagrams will help shine a light on your cloud architecture to provide better clarity

It is now possible to enrich your Hava auto generated cloud architecture diagrams with custom connections. This feature lets you connect any two...
You can now add comments to your cloud architecture diagrams automatically generated by Hava.
Hava automates your cloud infrastructure diagrams by connecting your AWS Azure and GCP accounts. In this post find out what you can do with Hava.