aws
How to fast-track cloud network architecture redesign
When you take on a cloud infrastructure redesign project, the first job to be done is establishing what is running where and to get that documented....
Who is creating your cloud infrastructure diagrams in 2024?
Please say it's not you, or a junior developer with a freshly minted copy of Visio.
Are you even diagramming your cloud environments? We hope so, as there are a lot of good reasons to keep on top of network doco and have accurate up to date diagrams on tap when you need them. These include:
We always strongly argue the case for cloud network documentation, and we definitely even more strongly advocate that you automate the process.
Once you adopt a fully automated documentation platform like hava.io by simply connecting your cloud accounts to the application, everything else is hands free. On top of automatically generating diagrams for all the VPCs or virtual networks detected in your cloud config, Hava also continuously polls your config and when changes are detected it generates a new set of diagrams on auto pilot. No need to log in, no need to manually sync or delete and regenerate the diagrams.
Why is this important? Because we've been there, on the front lines, supporting client cloud infrastructure, deploying resources and applications and we know post deployment your mind is immediately drawn to the next feature card or ticket and rarely on updating infrastructure doco.
So in short if it isn't automated, the chances are it doesn't get done.
When you integrate Hava into your cloud engineering workflow you can forget about spending time creating or updating diagrams. It's all taken care of. You get on with the important productive stuff and Hava takes care of the paperwork.
So we think the accuracy, hands free nature of diagram generation and the automatic nature of the change detection, auto updating and versioning makes Hava the best cloud diagram software in 2023.
So why do world leading MSPs and fortune 500 companies choose Hava?
Coupled with all the reasons listed above, the fact that Hava is API driven and can be completely self-hosted removing any compliance or security concerns and has multiple pipeline integrations that take away the pain of documenting cloud infrastructure, Hava is a clear choice for serious cloud engineers, architects and managers.
Hava allows you to connect your AWS, GCP and Azure cloud accounts, or stand alone Kubernetes clusters and the application auto generates a number of diagrams for each VPC, virtual network or container cluster discovered.
The diagrams are interactive.
When you select a resource, subnet, AZ or other grouping, there is an attribute panel to the right of the diagram which shows you all the known attributes, settings and metadata related to the selected resource (including a cost estimate). This data isn't displayed directly on the diagram canvas as it would make the diagram messy and unreadable.
The first diagram is the infrastructure diagram. Each cloud account connected to Hava will produce a diagram set per VPC. There are no limits to the number of VPCs you can diagram in a single data source (cloud account) and you can connect as many data sources as you need (plan permitting)
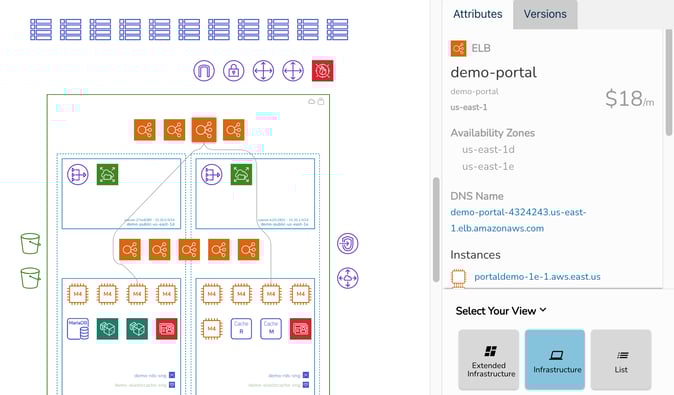
The above AWS diagram is laid out by availability zone (dotted columns) contained within the VPC (green rectangle) and shows each subnet configured (blue rectangles). Selecting a resource, in this example an elastic load balancer, changes the attribute pane to show details related to the ELB and reveals the connections from that ELB to two EC2 instances.
So you can visually see exactly what is running in this VPC and interrogate the resource settings without having to log into your AWS console, which can save you a lot of time if you are flipping between client networks.
While all the major resources are visualised on the infrastructure diagram, things like network interfaces, ACLs and storage volumes are not displayed as they can overwhelm the diagram. However, you might need to know about these second tier resources so Hava also generates a List View.
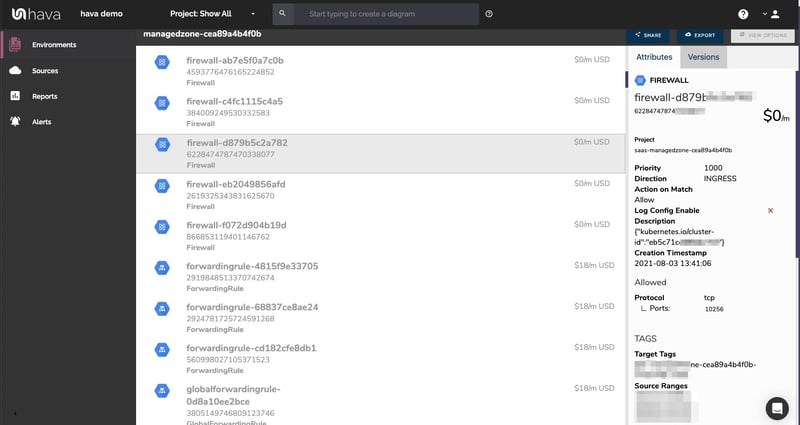
The list view displays estimated costs for each resource and is interactive. You can also sort the list and export to CSV for cost analysis or business intelligence purposes.
The next view is unique to Hava and is likely to make your security team's year.
The security view.
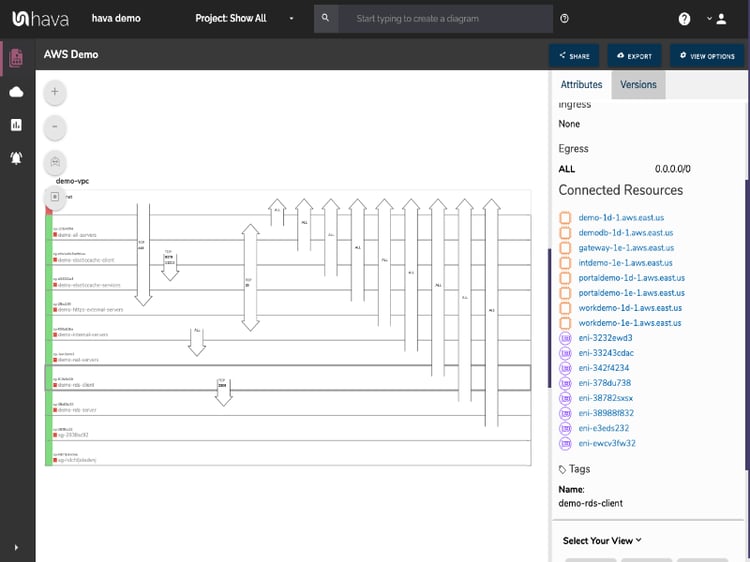
The security view available for AWS (shown above) and Azure visualises your security configuration. All the security groups are shows and are interactive. So you can select an SG and see the ports, ingress, egress and connected resources.
Overlaid on the diagram are arrows representing the open ports and protocols showing your security team at a glance what ports are open, what security groups control them and how traffic enters and exits your virtual network.
This visual at-a-glance representation of your network security posture surfaces potential problems that your security team can spot from a mile away.
Container are also visualised on separate diagrams. Whether that's cloud native ECS, EKS or AKS container workloads or stand alone K8s clusters, Hava will visualise the workloads.
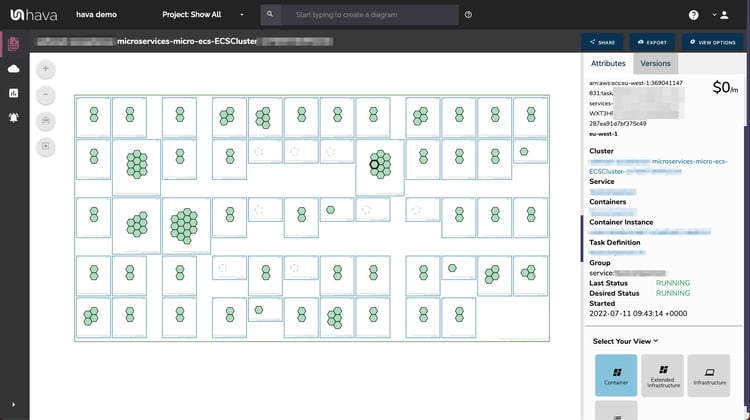
In this ECS Cluster example, the bounding green rectangle represents the ECS Cluster. Each blue rectangle is an ECS Service and the hexagons are ECS tasks.
At a glance you can assess the health of each task, whether it is running, stopping or starting, or stopped when it shouldn't be.
Hava is a web app that can be used over the internet on a SaaS basis. Once you sign up, you can log in, connect your cloud accounts and let Hava work its magic. Nothing to deploy or maintain, it's all taken care of.
However, some enterprise clients have strict governance or security policies that prevent them connecting to Hava SaaS. In these circumstances you have the option of self-hosted.
You can deploy Hava on your own infrastructure, behind your own security which solves the majority of compliance issues. The self-hosted option is a little more complex as you would imagine, but we have engineers and partners available to ensure your self-hosted deployment is a successful and smooth process.
As engineers we appreciate the desire to script and integrate as much as possible in your ci/cd or deployment pipeline. We are constantly building integrations to make that easier.
Currently you can leverage integrations with GitHub and Terraform on the deployment side, and a confluence plug in to take live interactive Hava diagrams into your Wiki.
Also Hava's embedded viewer allows you to take interactive diagrams, restricted diagrams and static diagrams and place them anywhere that supports iFrames.
Hava isn't a drawing package like say Visio.
You can only generate diagrams of existing infrastructure.
This is by design.
Hava renders accurate diagrams from cloud configurations. What's running is what is shown on the diagram. The results are not editable, so you can rely on the diagrams as a true representation of fact, especially during a compliance audit.
There is no way to add non-existent resources to a diagram, just like there is no way to remove a running resource. Hava diagrams are a source of truth.
That said, you can export Hava diagrams to Visio as a starting point for redesigning or building out infrastructure.
If you have any questions, hit up the chat widget on the bottom right of this page, or email sales@hava.io

Alternatively you can hop into a fully featured 14 day free trial using the button below.
There is no obligation or credit card required.

When you take on a cloud infrastructure redesign project, the first job to be done is establishing what is running where and to get that documented....
If you are running workloads on AWS, Azure or GCP you can benefit from fully automating your cloud diagrams freeing your cloud engineers for much...
The benefits of good cloud architecture documentation are countless and hard to ignore. In this post we take a deep dive into the many reasons you...