aws
Dynamic Cloud Diagrams
If you are running cloud architecture on AWS, Azure or GCP you can benefit from dynamic cloud diagrams generated with Hava.
It is important for businesses and their engineering staff to have a good understanding of how their cloud infrastructure works and how it hangs together. One way to help with this understanding is to create diagrams that illustrate the various components and how they fit together. In this article, we will discuss the benefits of automating the creation of your cloud computing diagrams.
One of the primary benefits of automating the creation of cloud computing diagrams is the time and effort it can save. Creating diagrams manually can be a time-consuming and tedious process, especially if the diagrams are complex or if there are many changes being made to the system. Automating the process allows for the creation of diagrams in a much shorter amount of time, freeing up your valuable resources for other tasks.
Another benefit of automating cloud computing diagrams is the accuracy and consistency it can provide. When diagrams are created manually, there is a risk of errors being introduced due to mistakes or oversights. Automating the process ensures that the diagrams are created accurately and consistently, reducing the risk of errors and ensuring that all team members are working from the same set of information.
Automating the creation of cloud computing diagrams can also help to improve communication and collaboration within your organization. Diagrams are often used to communicate complex ideas and systems to team members, and having accurate and up-to-date diagrams can help ensure that everyone is on the same page. Automating the process can help to ensure that diagrams are always current and accurate, which can facilitate better communication and collaboration.
When you are onboarding new cloud engineers or consultants, having a well laid out clear diagram of your environment allows them to immediately grasp exactly what you have running and how it is connected. This greatly reduces the time it takes new staff to comprehend exactly what is going on in your cloud environment which is a huge time saving and advantage over manually trawling through cloud consoles trying to decipher what is running where.
In addition to the benefits mentioned above, automating the creation of cloud infrastructure diagrams can also help to reduce costs. Creating diagrams manually can be expensive due to the time and resources required. Automating the process can help to reduce these costs, freeing up expensive technical resources that can be used for other purposes. Auto discovering running resources can also surface unused resources or entire old test or staging environments that are still running and costing your business money.
Hava is an application that supports AWS, Azure, GCP and stand alone Kubernetes clusters that can be used to create fully interactive diagrams quickly and easily. Hava includes features such as version control, collaboration tools, and integration with other tools and systems like GitHub, Terraform and Confluence which can further facilitate automation and the utility of your cloud documentation.
On top of the initial time saving when you generate a diagram, Hava also frees you from any time or labour keeping diagrams up to date. The application continuously polls your cloud configuration and updates automatically when changes are detected.
This means you can hop into your Hava dashboard at any time and see exactly what's running now. You can pull documentation for audits, governance or to see exactly what you have running whenever you like.
Hava's versioning retains superseded diagrams that you can use to track changes over time or find changes fast. If you are experiencing cloud network or application problems, you can compare what is running now with what was running before changes which can help identify and changes or missing resources.
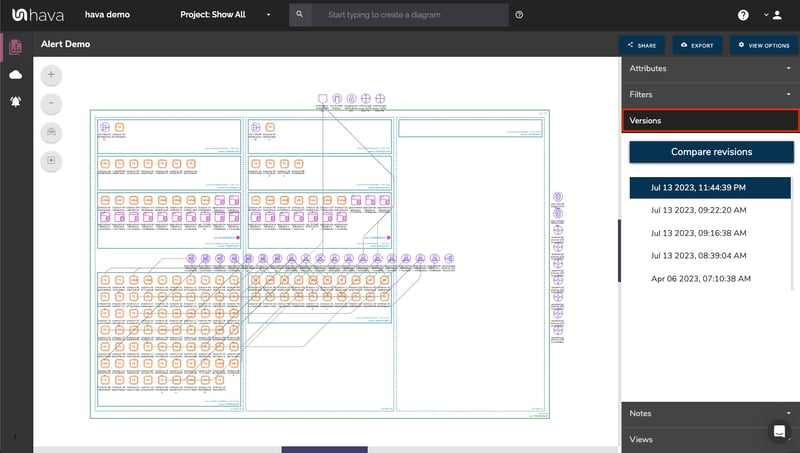
Hava versioning also helps you answer questions around what has changed since previous compliance or security audits. Depending on your subscription level, you can track back between 3 and 12 months and view every change detected by Hava.
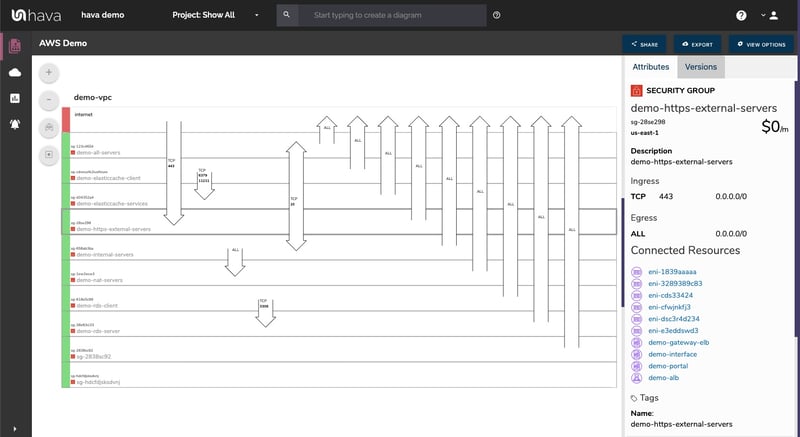
Talking of security, when you connect an AWS or Azure account (data source) to Hava you will also generate a security view diagram. This diagram shows you the security groups you have configured, what resources they connect to and overlaid on the diagram are the ports and protocols that are open and allowing traffic ingress/egress which can help your security team identify potential problems that may otherwise remain undetected buried deep in your cloud console settings.
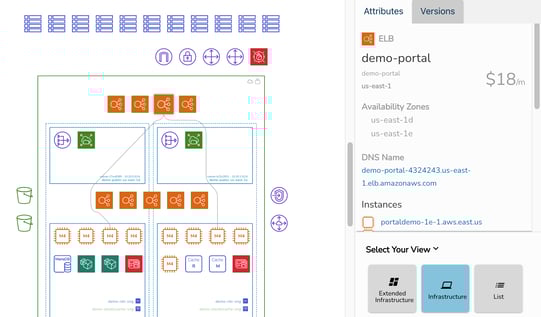
All the diagrams in Hava are interactive. This means that you can select a resource on a diagram and the attribute pane to the right of the diagram will display all the settings and metadata related to the selected resource. This saves an incredible amount of time flipping between console and diagram and also means the diagram is kept clean and readable while also providing you with all the information you need for all the resources, VPCs, subnets and AZs on the diagram.
In conclusion, automating the creation of cloud computing diagrams can provide a number of benefits, including saving time and effort, improving accuracy and consistency, facilitating better communication and collaboration, and reducing costs.
Hava is the go to solution for cloud professionals that can be used to automate the cloud documentation process, and can help businesses to more effectively understand, rationalise and utilise cloud computing resources.
We invite you to take a fully functional Teams plan for a 14 day free trial and see exactly what you have running where using the button below.
You are also welcome to request a one-on-one screen share demo where we can discuss your use-case and requirements to see if Hava is a good fit for your business.

If you are running cloud architecture on AWS, Azure or GCP you can benefit from dynamic cloud diagrams generated with Hava.
If you are running cloud architecture on AWS, Azure or GCP you can benefit from fully automating your cloud diagrams with Hava.
If you are running workloads on AWS, Azure or GCP you can benefit from fully automating your cloud diagrams with Hava.