aws
AWS Network Architecture Diagram
The Hava AWS Diagram VPC tool is the easiest way to create interactive AWS Network Architecture diagrams that auto update and capture changes in a...
An AWS VPN Diagram is the easiest way to understand exactly how your AWS infrastructure is configured.
There's no doubt that a good AWS VPN diagram is invaluable when trying to understand your AWS infrastructure and communicating how your network topology has been constructed.
When you are building applications or managing AWS infrastructure its not difficult to appreciate how valuable network diagrams can be. However the challenge has always been finding the time it takes to manually draw complex infrastructure diagrams using traditional drag and drop charting applications
If you only have a handful of resources and services in a single network then manually tackling your network diagrams isn't that challenging, however when you have a large network footprint, with multiple VPCs replicated across different availability zones or regions, and different production, development and staging networks, the task becomes a larger challenge that could take days or even weeks.
Then when you have created your AWS VPN diagrams, you need to keep on top of all the changes in your network and update your diagrams as changes are made. If your diagrams aren't up to date, then they lose their value.
We understand how difficult creating and maintaining accurate network topology can be because the team behind Hava are engineers that come from a cloud consulting and expert services background.
Our engineers were faced with the same challenges you face. You might be taking existing infrastructure when joining a development or devops team or you might be taking on a new client network. In each case the first thing you need to establish is what does the existing infrastructure look like, what resources have been provisioned, what VPCs exist, what availability zones and regions are in play, what does the security look like. All things that can be answered easily when accurate up to date documentation is available.
With access to such diagrams you will know exactly what is running, how traffic traverses your network and applications, you'll know where your data is stored and who can access it. Once you know exactly what is going on, you can better support existing applications or start to make improvements in performance, reliability and availability and also start from a position of strength when introducing a new feature or project into an existing production environment
If you are an application architect, system or network architect or a project manager, a well laid out AWS VPN diagram of your development environment allows you to see at a glance whether your design has been implemented as expected. With everything visually mapped out, you can spot the vulnerabilities and to know what to expect if say an AWS availability zone or entire region experiences an outage.
The problem with manually maintained network documentation (if it exists at all) is the thought of scouring through you AWS console to find all the services that are running, how they are connected, what security groups control the access to them fills even the most diligent engineer with dread. Having developed, tested and deployed an application, the last thing anyone wants to do is to draw or update diagrams which is why fully maintained up to date network documentation is rarely available
Then of course, no sooner have you completed your diagrams, something changes and you have to update all your diagrams to reflect the changes. With the numerous modern CI/CD approaches like deploying infrastructure as code, or getting AWS to autoscale various resources in response to traffic loads, this process can take you days or even weeks for larger environments, especially if multiple AWS accounts and environments are involved.
Back when our engineers were providing cloud consulting services, they would routinely take several days or weeks to establish an accurate picture of what a new client's cloud network infrastructure looked like before suggesting changes to improve business outcomes. Like you, they had to access the client's AWS management console, scour through all the services to establish exactly what was running, where it was running and how the security was configured that allowed traffic into the network.
We knew that the information we needed for creating diagrams was available in the AWS config data and could be used to build an automated AWS VPN diagram tool to reduce the process from days or weeks of tedious manual diagramming down to a few seconds or minutes for larger environments. What was once a incredibly tedious task nobody wanted to do was condensed into a simple process of generating a set of cross-account role credentials, connecting to the Hava AWS VPN diagram generator and letting the application do the rest.
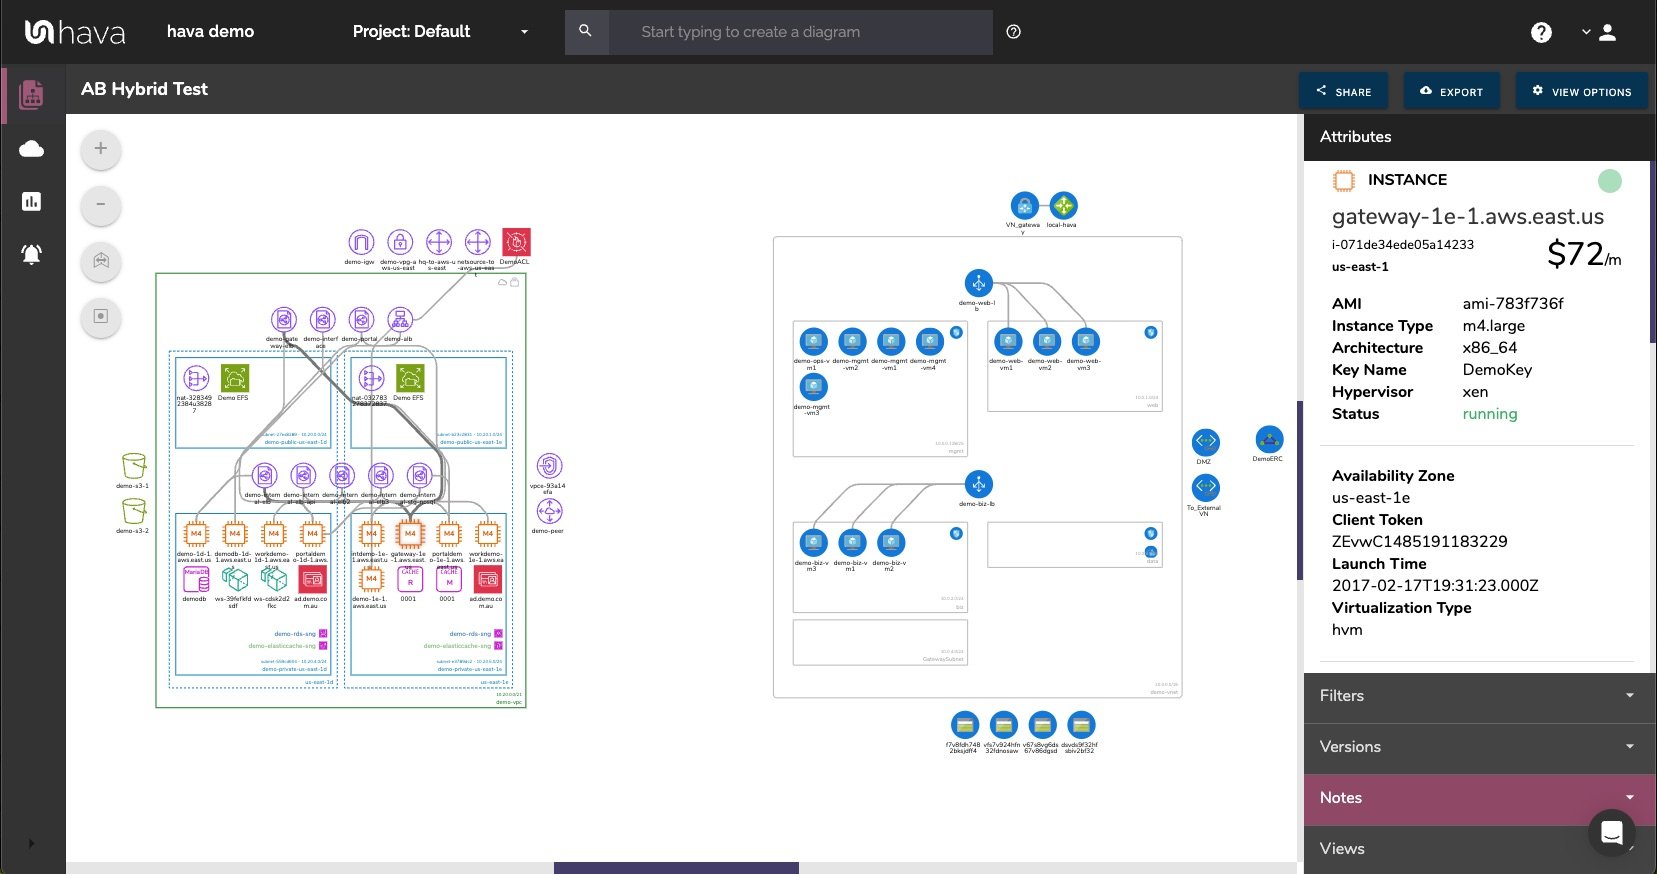
Initially getting the infrastructure mapped was the primary focus which was achieved with the Hava Infrastructure View.
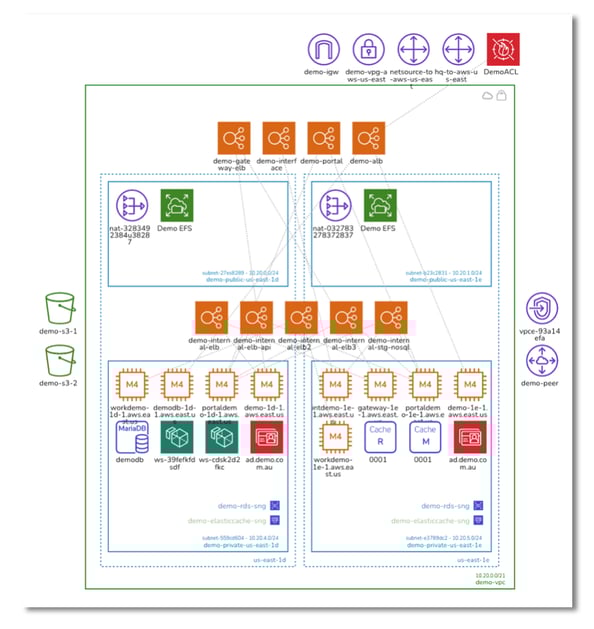
The Infrastructure view lays out your AWS VPN VPCs into separate diagram sets. Subnets within the VPC are grouped by availability zones. The AWS VPN Diagram generated also displays both internal and external resources.
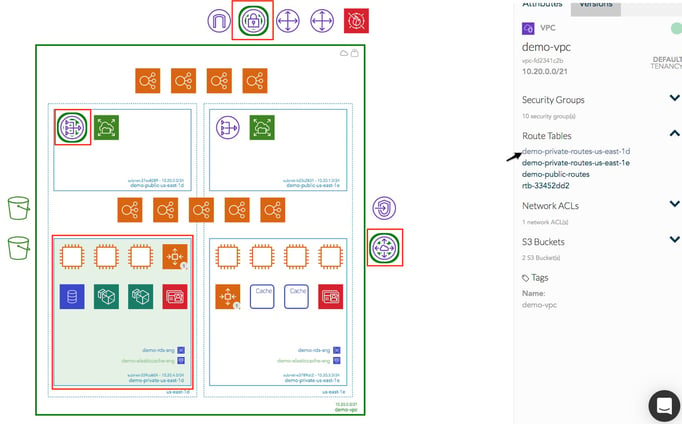
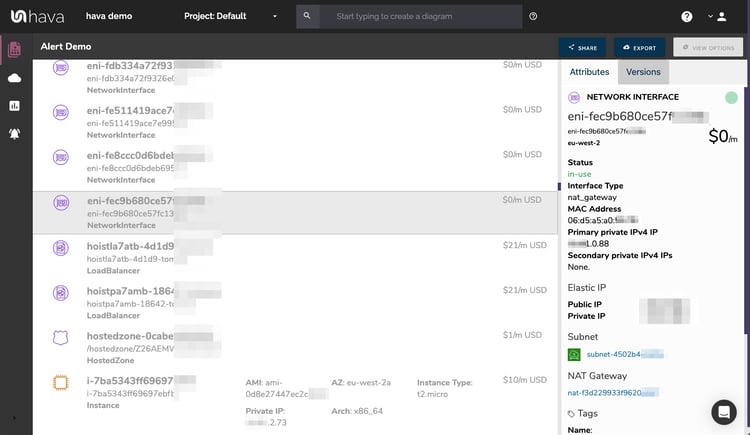
All the diagrams automatically generated by Hava are interactive. Selecting any of the resources visualized on the diagram changes the attribute pane to the right of the diagram canvas which allows you to take a deep dive into the resource configuration like security groups permitting access to the resource, IP address, ingress/egress ports, connected storage and so on. The infrastructure view diagrams also display the estimated costs of each resource which are totalled for the entire environment when the environment is opened up.
Once we have developed the infrastructure view and could see all the resources, we then thought about the relationships and connections between resources so created the ability to toggle on and off the ability to view connections.
There are some resources that aren't as critical as others. Some networks can have hundreds of network interfaces that could potentially flood a diagram and make it difficult to see more important resources like compute EC2 instances, load balancers, database instances etc. To combat the problem of over crowded diagrams, Hava only visualizes the important elements detected in your AWS account.
Although these less important components are not visualized on the infrastructure diagrams, you may need to know about these 'non-visualized' components, so we designed the "List View". The List View is an extensive data set that lists all the resources discovered in your AWS configuration. This view details both visualized and non-vizualized resources.
The listed resources on this report also have an estimated cost detailed against them.
One of the major benefits of the list view is the ability to sort the list by each column. When you sort by estimated costs it surfaces what resources make up the bulk of your estimated cloud spend which should help when you are looking to save costs or explain to your management which important resources make up the bulk of your AWS budget.
You can also export this list of resources in CSV format for spreadsheets which CFO's and accountants inexplicably seem to enjoy.
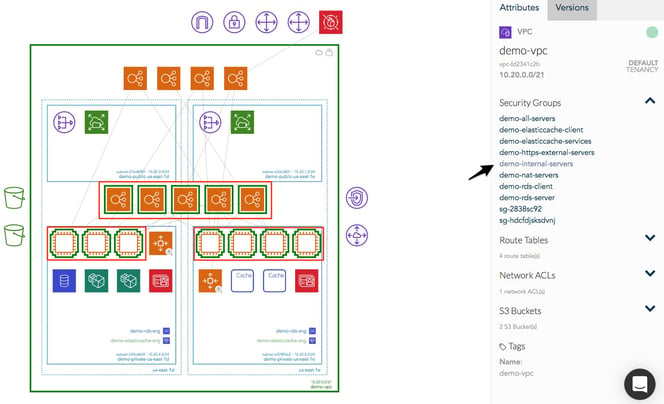
The Security View was next diagram we added to Hava. Since we already had the configuration metadata and relationships coming back from AWS, our security team clients asked if we could visualize the security relationships the same way we were able to visualize infrastructure. The challenge was accepted and the AWS Security View was born.
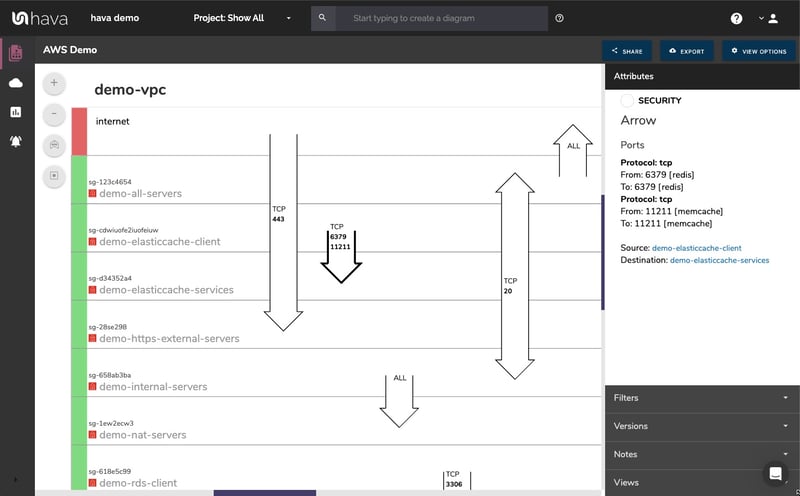
The security view visualization shows you all of your AWS security groups and will overlay the open ports to show how user traffic traverses your network.
You can select a security group on the diagram to see all the connected resources in the right hand attribute pane, as well as the ingress and egress port numbers and associated IP addresses related to that resource.
This high level view makes some security config issues obvious, like ports used for development or testing that have been left open or ports that haven't been locked down at all.
The AWS security view is truly unique and is a result of input from a team of industry practitioners knowing exactly what information is important to enable effective visualized security monitoring.
As more development teams embrace containers to deploy applications and provide portability of software between environments we added the Container View to Hava.
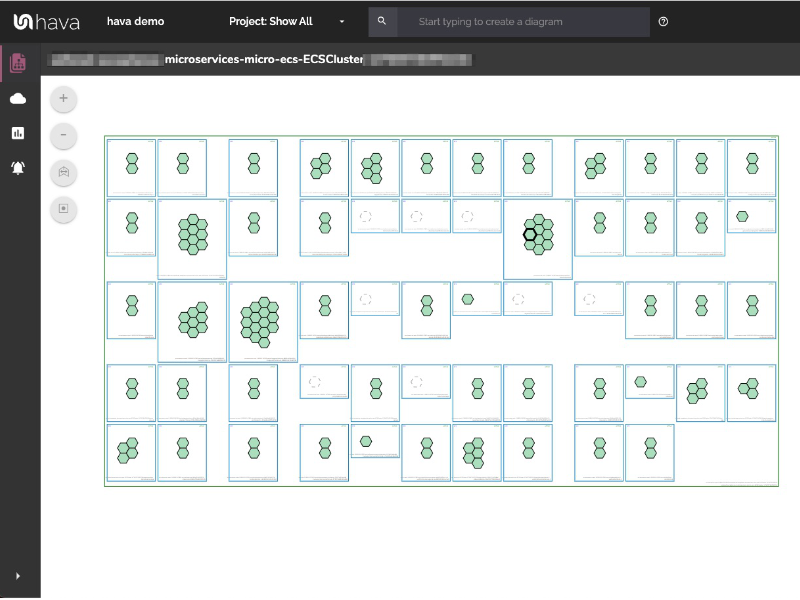
The container view displays your ECS Services and the contained ECS tasks inside the ECS Clusters.
Hava continuously scans your AWS architecture and when changes are detected a new diagram set is automatically generated. The superseded diagrams are not discarded or overwritten. Instead they are moved into version history. Still fully interactive.
What this means is you can view your cloud architecture at any point in time and also leverage Hava's revision comparison (Diff Diagrams) to quickly identify what has been added or removed between the two diagram dates.

So you can easily identify all the changes made since your last compliance audit, or see what changed yesterday that is causing unexpected network or application errors.
While diff diagrams are super helpful in diagnosing changes after the fact, you may want to keep on top of changes as they happen.
Hava's architecture monitoring alerts will let you know the minute a change is detected. You simply nominate the environment you wish to monitor and add a group of recipients to receive the alerts. When a change is detected like the addition or removal of a resource, Hava will send each recipient a diff diagram showing the changes.

Now you and your security team can be across every change as it happens so you can assess and take action if required.
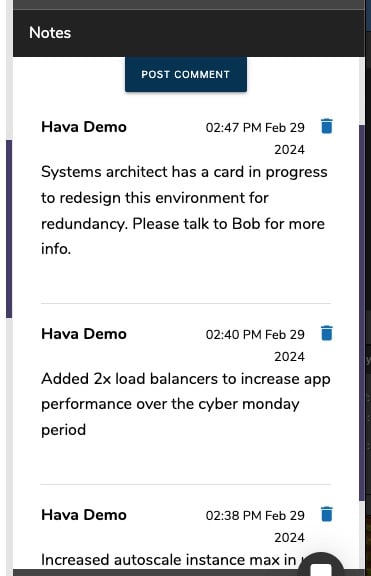
For every architecture diagram generated you have the ability to add text comments. This serves as a rolling dialogue your team can contribute to that may better explain elements of the diagram or bigger picture concepts related to the diagram.
Notes are accessed from the accordion menu within the attribute pane.
New notes are added to the top of the list so they are stored in chronological order.
Whichever diagram or view makes the most sense or delivers the information your team needs to build and manage your environments, the upside to using a hands free automatic AWS Cloud Diagram Tool like hava.io is that your diagrams are sourced directly from your AWS configuration, so nothing is missed out and nothing can be added by mistake.
What you see is from the source of truth, your diagrams are always accurate and always up to date.
When your AWS VPN configuration changes, so do the diagrams. Updates are automatic, hands-free, no human interaction required. The diagrams that are automatically superseded are archived in a version history. You can open up the older versions of your diagrams at any time you like. They are fully interactive so you can compare old configurations to new ones to find out what changed in the event of a problem or compliance audit.
The diagrams generated by Hava are also exportable. You can produce an AWS VPN Diagram PDF or a JPG for inclusion in your reporting as well as CSV and JSON.
There are currently two options for using Hava to generate your cloud infrastructure diagrams.
Option 1: Hava SaaS
The SaaS option is by far the quickest and easiest way to start automatically generating AWS VPN diagrams.
You simply create an AWS cross account role with read only permissions, then log into hava.io and connect your AWS account. Hava will read your AWS config data and generate the diagrams. Then as changes are detected Hava will start to generate version history for audit purposes.
A 14 day fully functional trial is available (along with demo data) so you can try Hava for yourself. At the time of writing, no credit card is required to take the trial.
Option 2: Self Hosted
The self hosted option allows you to run Hava from within your own AWS infrastructure. If you have particular security or enterprise policies that prevent the connection of 3rd party applications to your cloud environments, then self-hosted may be the solution.
Both the SaaS and self-hosted options are identical in functionality, but you will need to contact our support team to organise a self-hosted solution.
As well as using the application console to generate and view diagrams, Hava has a fully featured API that allows you to programmatically add and remove data sources, projects and request diagrams.
We recommend requesting a one on one demo with our sales team if you would like to see Hava in action and explore the self-hosted option.

You can contact us via sales@hava.io or jump into a free trial here:

The Hava AWS Diagram VPC tool is the easiest way to create interactive AWS Network Architecture diagrams that auto update and capture changes in a...
The Hava AWS Network Topology Diagram Tool is the easiest way to create interactive AWS Cloud diagrams that auto update and capture changes in a...
The Hava AWS Diagram tool is the easiest way to automatically create interactive AWS Cloud diagrams that detail regions used in your VPCs