aws
Container Diagram Generator by Hava
Visualise your container workloads with the Hava's AWS ECS, EKS, Azure AKS, GCP GKE or Kubernetes Container Diagram generator. Find out more...
With more and more development teams embracing containerised packaging and deployment of their applications and micro services, the ability to visualise the current state of containerised workloads has become important.
AWS Elastic Container Service (ECS) is a popular container orchestration service and one of the AWS services that is detected and visualised when you connect your AWS account.
When an ECS cluster is detected Hava will create an AWS ECS Architecture Diagram that is internally referred to as the Container View.
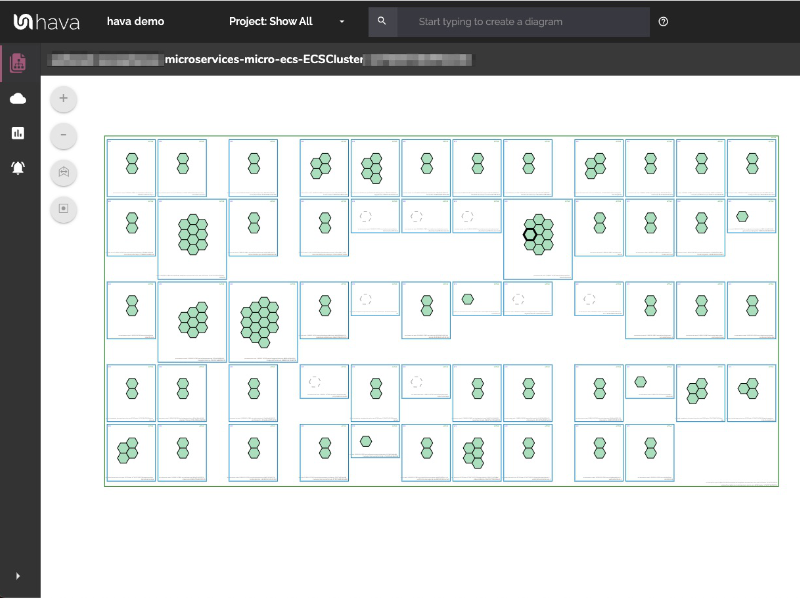
The container view lays out the detected ECS Cluster, displaying all the tasks and services configured in the cluster, load balancing and unused or pending capacity.
Inside the diagrammed ECS cluster you will see all the service containers and the individual tasks running in each one.
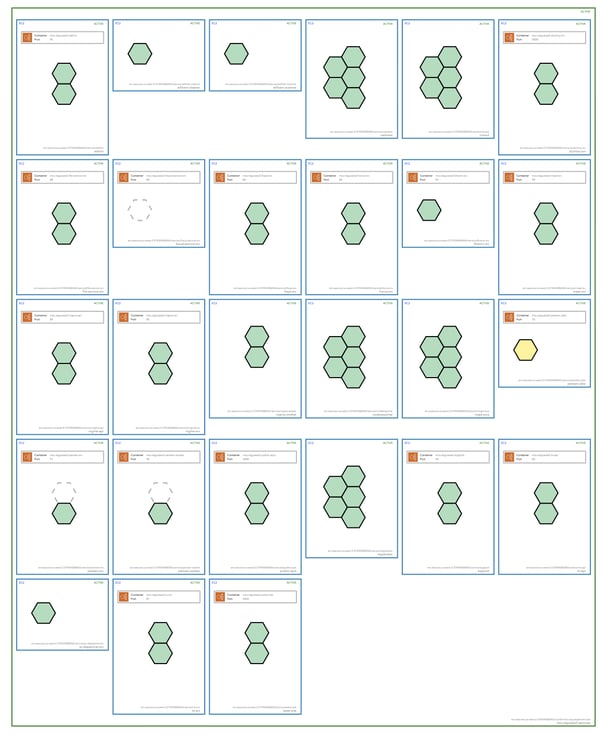
On the diagram at the top of each container you can see the state of the container and the location of it, while at the bottom, you can see the name and ID of the service. All Hava diagrams are interactive. So clicking on resources or elements of a diagram will change the contents of the attribute pane on the right hand side of the diagram to display the metadata related to the selected resource. This is true for the container view.
Clicking inside one of the services for instance, will display information related to the service.
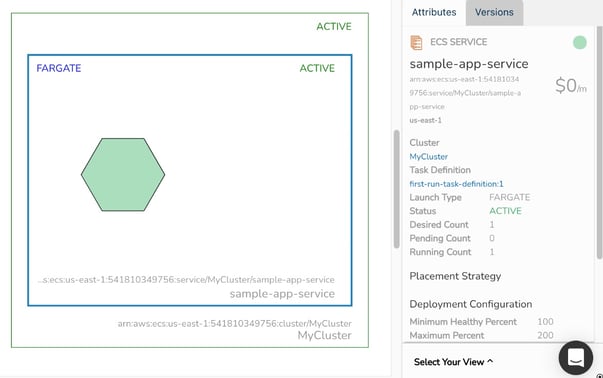
The service attribute pane will show the service name, task information, load balancer information if one is associated, placement strategy, deployment configuration and the running tasks.
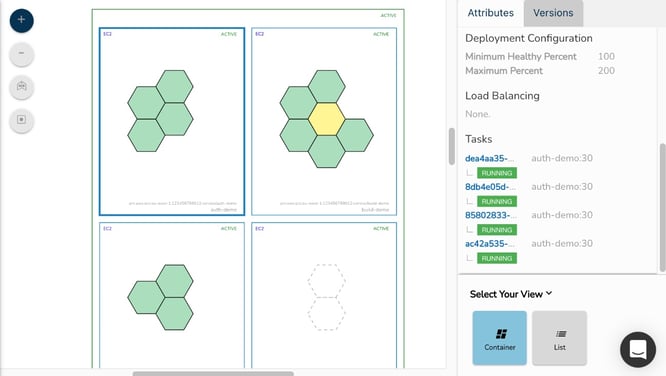
Towards the top of the service you will see load balancing information if there are any load balancers connected to your containers. This will show the port and the container the load balancer is connected to for each task. Click the load balancer box to see more information about the target group or class load balancer that is attached.
Each of the tasks running within the service are shown as a hexagonal icon that can be clicked to see the information for the specific task. Tasks are displayed in different styles depending on their current state:
Green tasks are running successfully.
Yellow tasks are in a pending state, usually starting up or shutting down. You can click the task for more details.
Dashed tasks are spare capacity in the service, where the desired count is less than the running count.
To start visualising your containerised ECS workloads, you can take a free trial of Hava using the button below.
Hava is available as a SaaS where you can simply connect a set of read-only cross account role credentials, or we can provide a self hosted solution where you can run Hava on your own infrastructure should you have security or internal policies that dictate that the self hosted solution is more appropriate.

If you would like a one on one demo please get in touch and we would be happy to run you and your team through Hava and the diagrams you can create in addition to the AWS ECS Architecture diagram, like the VPC infratructure diagrams, the AWS security group diagram and all the other uses. Learn more here:

Visualise your container workloads with the Hava's AWS ECS, EKS, Azure AKS, GCP GKE or Kubernetes Container Diagram generator. Find out more...
AWS offers a huge range of compute options like EC2 instances, ECS and EKS Containers or Lambda Serverless. But which one is right for your...
The AWS Instance Scheduler is a smart way to reduce your Cloud Infrastructure costs that include AWS EC2 or RDS instances that are not required 24/7....