aws
Integrate Cloud Diagrams in your CI/CD pipelines using GitHub Actions
Easily generate and retrieve updated environment diagrams with the new Hava GitHub sync action. Add the action step to your GitHub jobs to fully...
Most developers and engineers working with cloud infrastructure will agree that a well laid out network topology diagram is an essential tool when either communicating how the network is built, or for use when tracking down the reason for an application outage or performance dip.
The major problem with network diagrams is that they are practically useless unless they are up to date.
If you are using manual drag and drop drawing tools like Visio or other charting tools to manually construct network topology diagrams you are at a double disadvantage. Firstly you need to spend a mind numbing amount of time transposing console configuration settings onto a diagram while performing analysis on each resource to find out where it fits on the diagram in terms of availability zones, VPCs or virtual network and subnets.
Secondly once you have spent days or weeks of your valuable time mapping out your infrastructure diagram, the dynamic nature of cloud computing would normally mean that by the time you have finished, something has changed. Maybe some compute instances have auto scaled in or out, or your database admin has replicated an RDS instance or your security consultants have added a firewall or changed port settings. Whatever the cause, if you don't keep on top of every single change to your network the chances are your diagram is out of date and no longer provides the utility you need to track down problems when they inevitably occur.
The solution is to forget about manually creating and updating your AWS, GCP or Azure network diagrams in the first place and automate the process from the outset.
By using a purpose built cloud network diagram generator application like Hava, you can eliminate days or even weeks of manual labour building network diagrams with drag and drop drawing packages.
By simply connecting Hava to your cloud accounts, be that AWS, Google Cloud or Microsoft Azure using secure read-only credentials, you can get an accurate representation of your cloud network in diagram form in minutes or sometimes seconds.
You get a diagram for each virtual network or VPC discovered along with a security diagram for AWS and Azure and container diagrams for any Amazon ECS workloads detected.
What sets Hava apart from other diagram builders, besides being cooler than penguin on a particularly frosty morning is the application's approach to keeping diagrams up to date.
We've seen solutions that require you to generate a whole new set of diagrams when you want an up to date diagram, which is always required to be manually invoked.
Hava on the other hand is more proactive, in that the application continuously polls your cloud account settings and updates diagrams when changes are detected. Automatically, hands free, no human intervention required. This means all the latest diagrams in your Hava console are up to date.
Even if there have been multiple changes since you last logged in, the live diagrams will be waiting for you. But how do you know if something has changed? Every time a new diagram set is generated, the superseded diagram isn't simply discarded or over written, instead it is moved to version history.
Versioning retains a fully functioning interactive diagram set depicting the previous virtual network state. You can open up older diagrams, click on resources, inspect settings and metadata as it was prior to a change being detected.
This means you have something to compare the current diagram set to should you need to identify new or missing resources causing unexpected network or application issues. If there have been multiple configuration changes in your cloud console settings since you last logged in to Hava, then there will be multiple diagram versions in version history that you can inspect and compare diagrams and have an audit trail of any changes made, which can be particularly useful during a security or compliance audit.
Hava auto-generates and auto-updates cloud network diagrams for AWS, Azure and GCP cloud computing users.
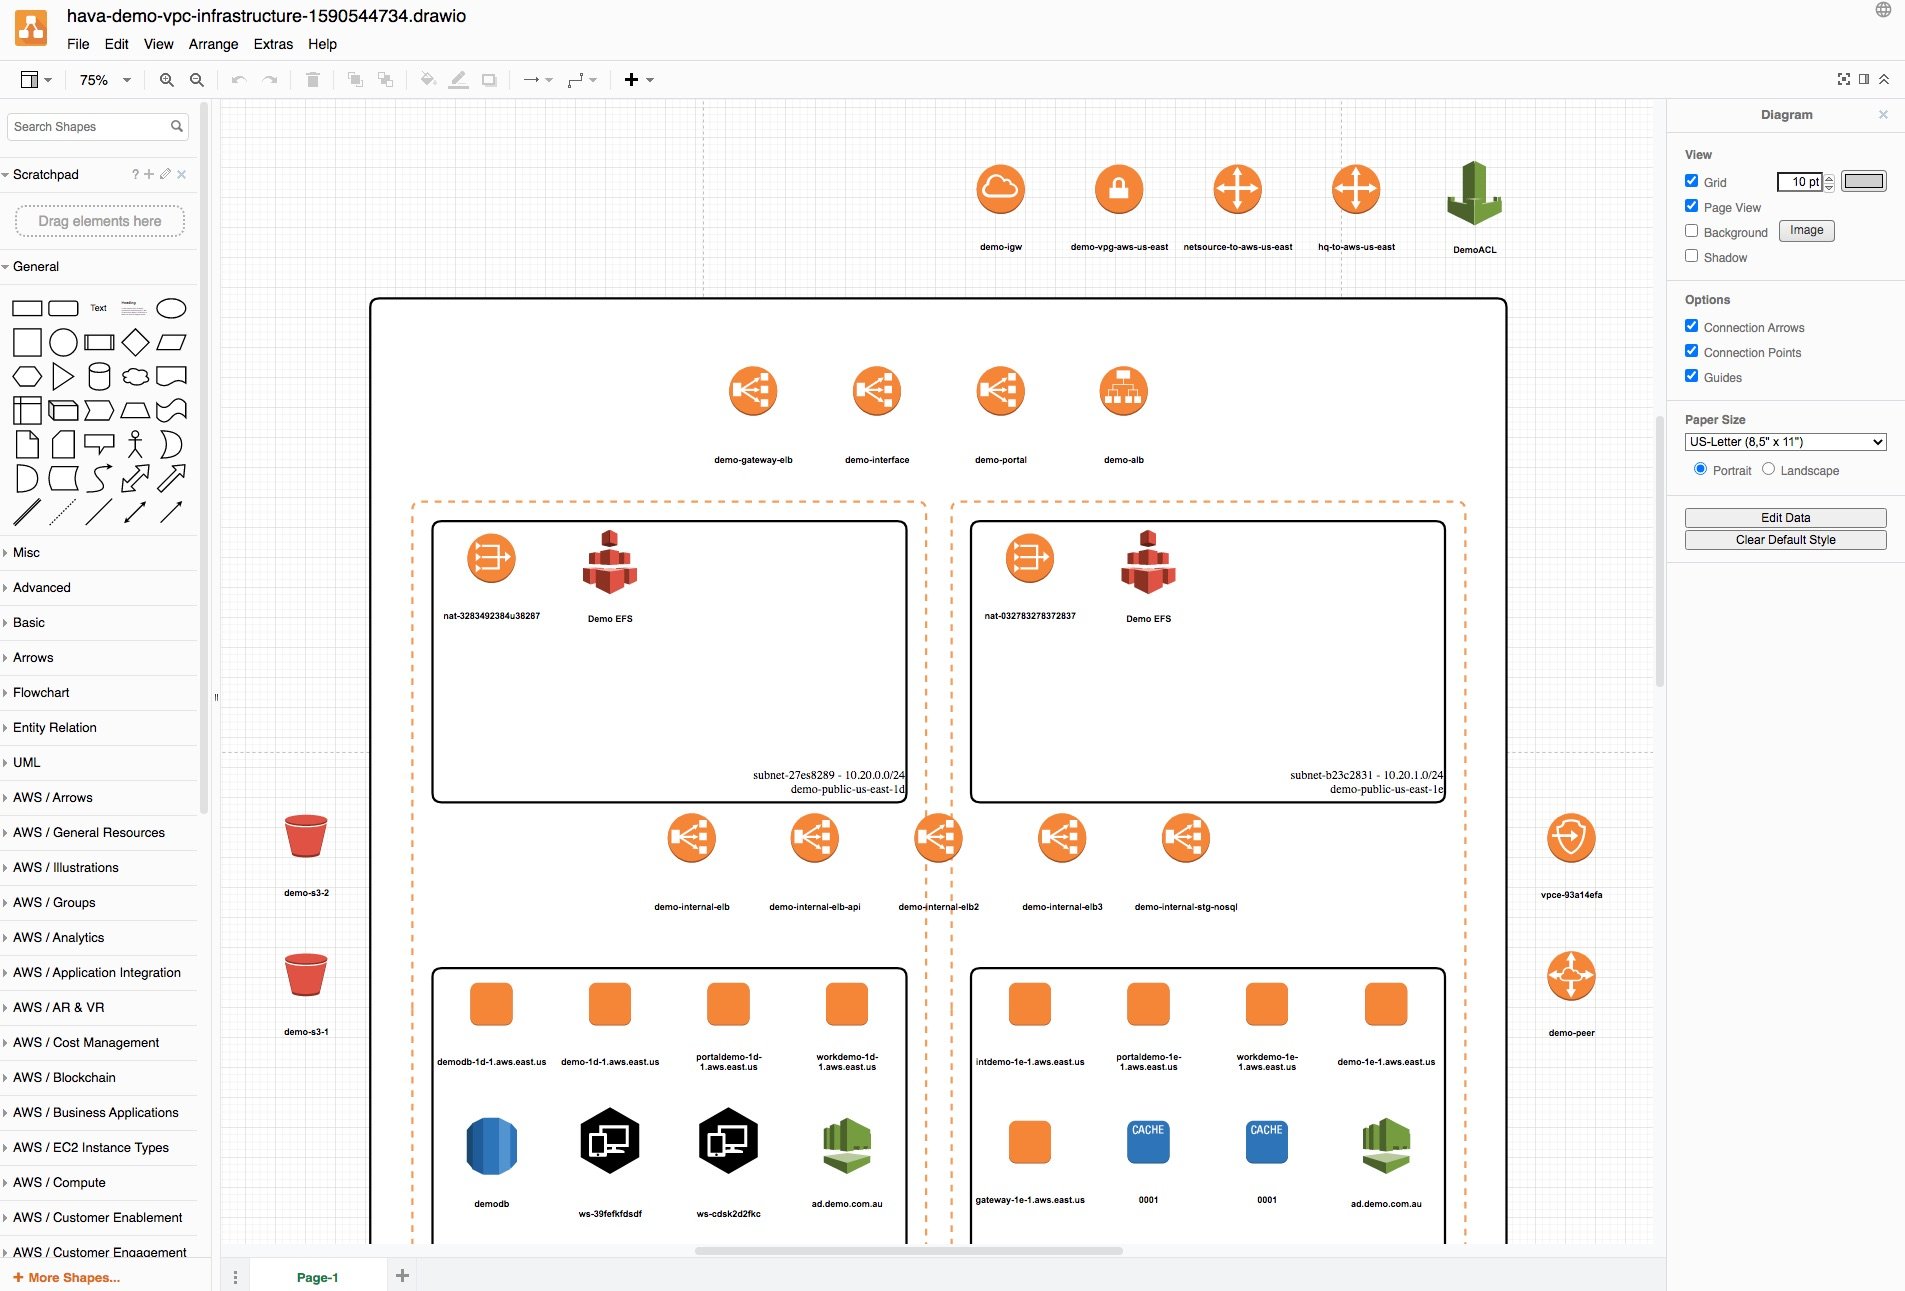
There are a number of cloud visualization diagrams that can prove useful to your engineering, DevOps and security teams. These include an AWS Infrastructure diagram like this:
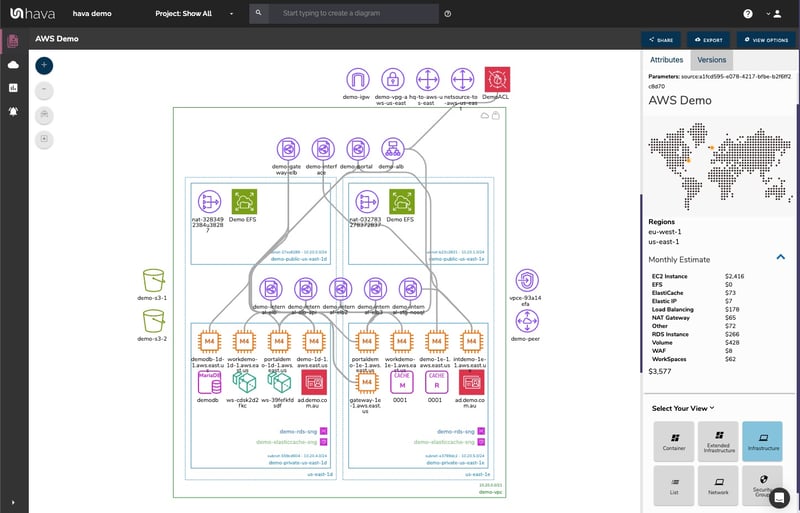
The diagram shown above logically lays out all the resources discovered when an AWS account is connected to Hava's cloud visualization tool. The main VPC is depicted by the green outside border and is surrounded by associated resources like internet and VPN gateways, S3 Buckets, VPC endpoints, VPC peering connections, Elastic Beanstalk environments and so forth.
Inside the VPC, your configured availability zones are set out in columns. These columns contain the individual subnets set up in those AZs. All the resources contained in each subnet are visualized as are any load balancers that are routing traffic to the various subnets.
Having your diagrams automatically created from your AWS console configuration data enables interrogation of each of the resources to see the settings and associations related to them. By selecting any of the individually visualised resources, the attribute pane to the right hand side of the diagram displays all the known metadata related to the resource. This is one aspect of Hava's cloud visualization diagrams that isn't possible with manually created drag-and-drop diagram makers.
Automating the diagram build using Hava also reveals resources you may not be aware of. Long forgotten database instances and sometimes entire development, staging or test environments are regularly discovered by this automated cloud visualization process.
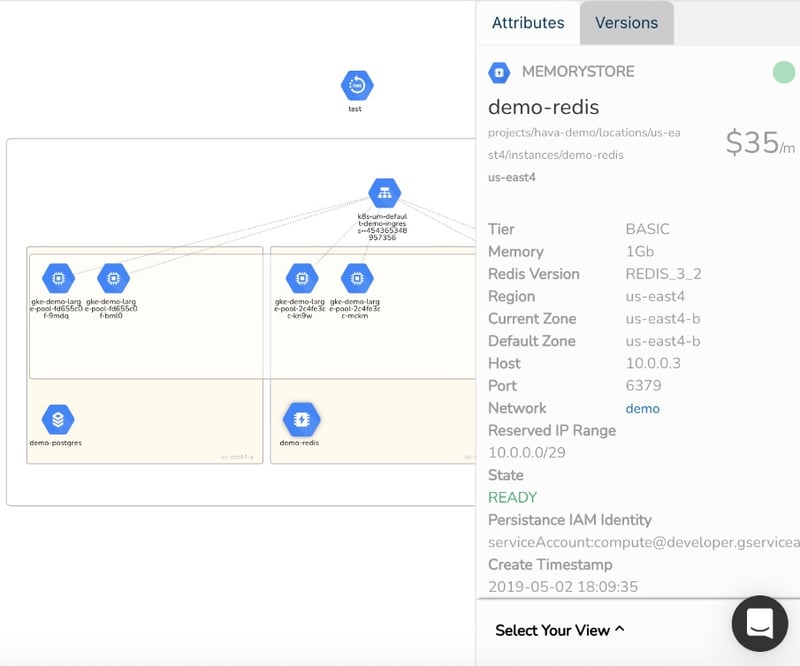
Hava's cloud diagramming tool will also connect to your GCP accounts and visualize your GCP networks, zones and subnets.
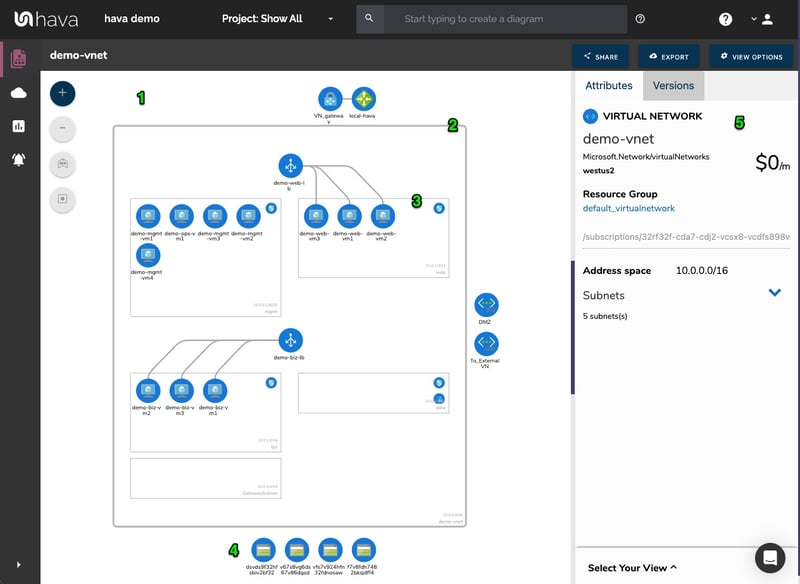
In addition to visualizing your AWS and GCP cloud environments, you can also import your Azure environments into Hava. Hava will create diagrams for each resource group discovered in Azure. The resource group will detail any virtual networks found in the resource group which in turn can contain multiple subnets and other resources like virtual machines, load balancers, peering connections and storage accounts.
There is always a compromise when it comes to automatically generated documentation. The way that Hava discovers and generates network topology diagrams is based at a VPC or resource group level. If more than one VPC is detected in your Amazon cloud account for instance, then one diagram set per VPC is created.
You may however want to combine two or more VPCs onto a single diagram, or just diagram a subset of your resources. This can be achieved using the custom query function built into Hava.
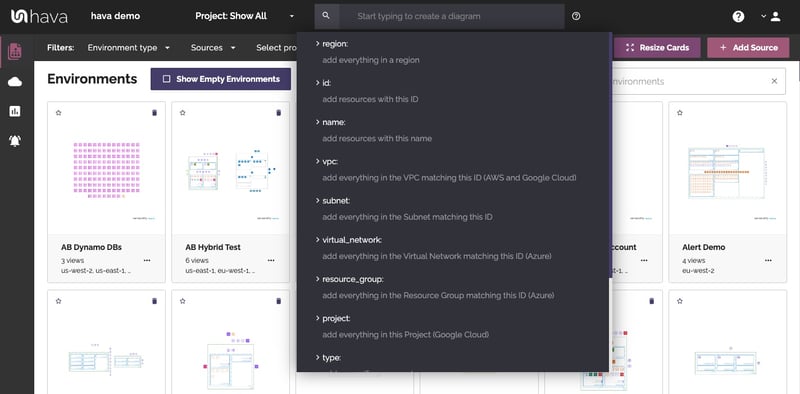
This custom query would create a new custom diagram containing the two nominated AWS VPCs specified. You would then have the ability to save this diagram so it is always present in your dashboard until you choose to delete it. As with all other diagrams, your custom infrastructure diagram would keep itself up to date and retain a version history every time a resource change is detected.
In reality it is just not practical to include every single component detected in your cloud config onto a network topology diagram. Take for instance network interfaces, volumes or WAF rules. In a large network with hundreds or maybe thousands of these second tier components, trying to visualize every single component would make the diagram almost unreadable, or certainly too busy to easily recognise the core components.
Hava's cloud visualization tool solves this issue by providing detailed components list that details every single resource detected. This is known as the "List View"
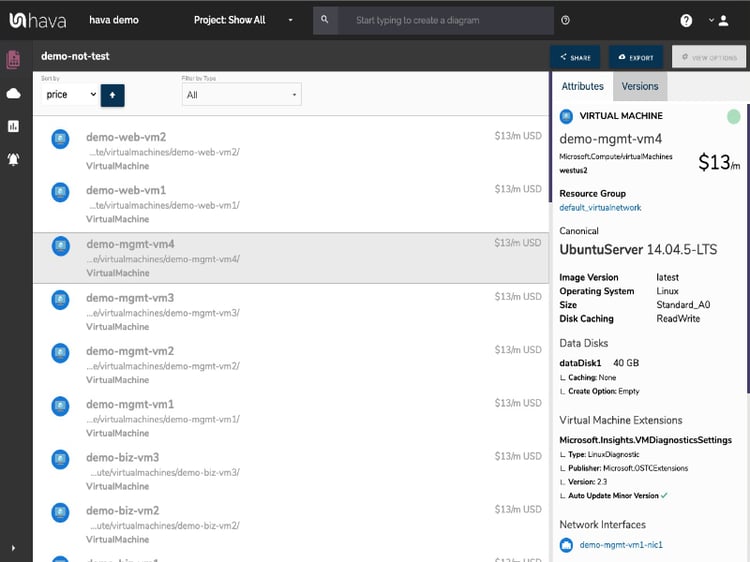
This is a comprehensive list of resources that can be sorted and exported along with estimated monthly costs so you can see at a glance what resources are costing you the most money. This detailed list view is also interactive. Selecting a resource on the diagram will reveal all the known settings and associations that resource has.
Another major benefit of using Hava to automate the discovery of your AWS environment diagrams is the ability to capture and visualize security group information. While only available for AWS currently, security views for Azure and GCP are on our development roadmap.
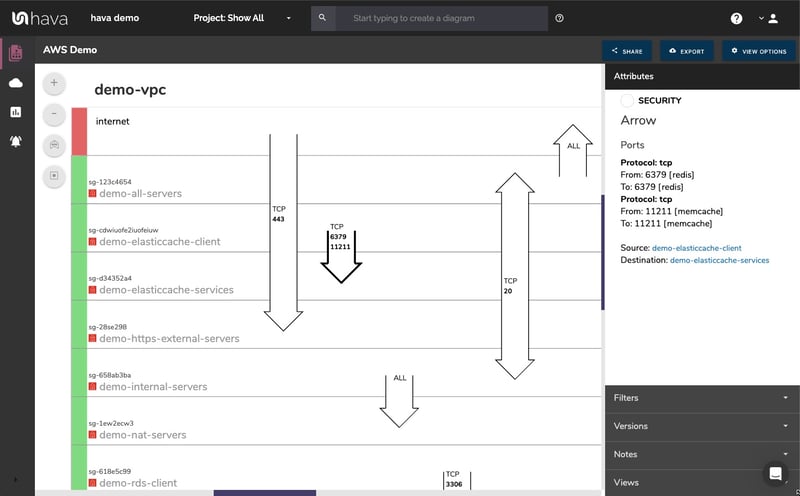
With an AWS security group diagram you can view all of your configured security groups. All your open ports are overlaid on the visualization to enable an instant understanding of the traffic flow, ingress and egress points. The security view diagram is also interactive which ensures you can select any security group on the diagram and important information relating to the security group, like the connected resources, ingress and egress IP addresses and associated tags are revealed without having to exit out to your AWS console to investigate.
The native cloud architecture diagrams created by Hava are the nearest we've seen to the examples and recommendations provided by the major cloud platforms. These are great to view and interrogate via the Hava application dashboard, however sometimes you might need to pull a set of diagrams for audit purposes or to incorporate into management or sales presentations.
The built-in diagram export function allows you to do this by providing these five export options
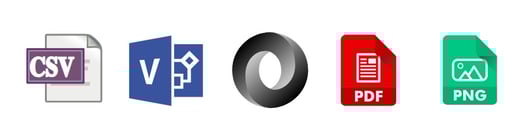
CSV, VSDX, JSON, PDF and PNG
When viewing any of your Hava diagrams, you can select the export function, tell Hava what format you would like and Hava will generate the export file for download.
Should you want to manipulate or embellish your auto generated Hava diagrams, exporting to VSDX format and using Visio, draw.io or any VSDX compatible drawing package will allow you to edit your diagrams as required.
Should you not have access to Visio but would like to try this out, try opening one of your exported VSDX files in draw.io (diagrams.net)
Getting Hava to do the bulk of the heavy lifting by initially generating accurate diagrams based on what is actually configured and running in your cloud environments enables you to access a base diagram ready to edit which will save you hours or possibly days preparing management reports.
There aren't too many cloud engineers, DevOps or project managers that would dispute the benefits of perpetually accurate network documentation. Hava provides just this with:

You can try Hava for free, learn more here:

Easily generate and retrieve updated environment diagrams with the new Hava GitHub sync action. Add the action step to your GitHub jobs to fully...
Hava gives you the ability to hide/reveal specific resource types on your auto generated cloud architecture diagrams. This blog post shows you how.
Easily generate and retrieve updated environment diagrams with the new Hava GitHub sync action. Add the action to your GitHub jobs to fully automate...