aws
How to Switch to Hava's New UI
Hava's new UI is now generally available. You can switch it on in your personal settings. Give it a go.
Hava is an application that analyses your cloud configuration and maps out the discovered networks and resources when connected to your AWS, Azure or GCP accounts.
After connecting your cloud accounts, you end up with a set of diagrams visualising your network infrastructure and resources as well as AWS security group diagrams and trusted advisor management reports.
 AWS
AWS
 GCP
GCP
 Azure
Azure
In this post we'll take a look at what you can use the various diagrams and features of Hava for.
If you have spent any amount of time manually drawing network topology diagrams with tools like Cloudcraft, Visio and Draw.io you will appreciate the incredible amount of time that is devoured by the process. Time you will never get back that could have been spent on much more important activities like delivering new application features, improving client network performance or hanging out with your family.
We were faced with this challenge when onboarding new cloud clients in our consulting business. The first task was always to get a good understanding of the client's infrastructure and diagramming what was running and where it was running.
This usually involved days or even weeks for time consuming, soul sucking manual labour trawling through consoles and logs trying to determine what was provisioned, what was running now, how it would behave during a zone or region outage, what the weak points were in terms of redundancy and security.
It soon became apparent that the diagramming process needed to be automated and the rest as they say, is history. Hava was created and eventually developed and released for other cloud engineers, managed services and development teams to document cloud infrastructure with the click of a button, instead of the hours and days it can take when you manually approach this essential task.
One of the benefits of automation is the removal of pesky humans from the diagram creation process. When you are working closely on a project, you can have a pre-conceived notion of what is running, which can lead to assumptions that everything you planned to provision has been and that nothing else is running that shouldn't be.
By scanning your cloud configuration, Hava draws down from the source of truth. Only resources that exist make it on the diagrams. There is no method of adding resources to a diagram that do not exist and conversely, there is no way to remove resources that are running but shouldn't be.
This ensures accuracy to a level that can be relied on in the event of a PCI compliance, Insurance or governing authority audit of your systems. Because there is no way to manually manipulate Hava diagrams, there is no reason to doubt the accuracy of the diagrams the application generates.

Just as the initial diagrams are automatically generated when you connect to Hava, all the diagrams are kept up to date for you, so you don't need to remember to go and edit your diagrams when you provision new resources.
Whether you are manually provisioning or removing resources, pushing infrastructure as code via CI/CD pipelines programmatically, deploying CloudFormation templates or letting your cloud platform provision resources via autoscale rules, Hava will detect the changes and create a fresh set of diagrams for you.
If you create custom diagrams like a hybrid cloud diagram detailing multiple vendor cloud components, or maybe a subset of a network like a particular resource type or a specific tag using the custom diagram builder, Hava will also keep these diagrams up to date automatically, so you don't need to remember to do the updates.
One of the major advantages of using automation to discover the resources that have been provisioned in your cloud network is that the scan and visualization process will often uncover resources that are running that are not part of your production application.
These can typically be duplicate development environments, resource snapshots or resources that were provisioned during the application development process but are no longer required. These resources are costing your business real money even if they have remained untouched for months or even years.
For example, we had a client connect their AWS account to Hava for the first time and when they reviewed the diagrams they found an orphaned RDS database instance that was costing close $2000/month. None of the engineers looking after the network knew anything about the database which turned out to be related to an old test environment that pre-dated the current team. This one unused resource had cost the business well over $100k
On the whole, cloud infrastructure from the three main cloud vendors is reliable and a stable platform on which to build your applications. However sometimes environmental or technical issues can cause an availability zone or an entire region to go offline. When this happens it would be good to know whether your application would persist via a combination of load balancing and replication across multiple regions.
By visualizing your network topology with logically laid out Hava diagrams you can see at a glance what resources are running in what regions and availability zones. So you can instantly see what would happen if an AZ or region disappeared.
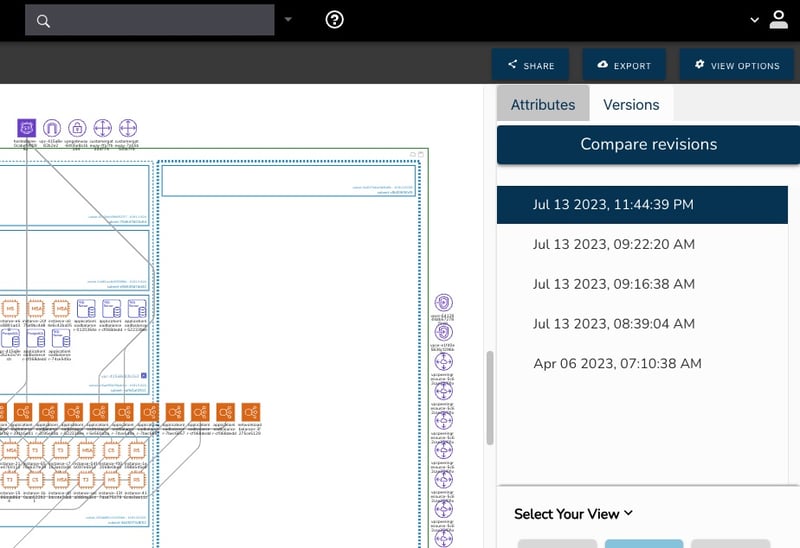
Hava continuously scans your cloud architecture and when changes are detected a new diagram set is automatically generated. The superseded diagrams are not discarded or overwritten. Instead they are moved into version history. Still fully interactive.
What this means is you can view your cloud architecture at any point in time and also leverage Hava's revision comparison (Diff Diagrams) to quickly identify what has been added or removed between the two diagram dates.

So you can easily identify all the changes made since your last compliance audit, or see what changed yesterday that is causing unexpected network or application errors.
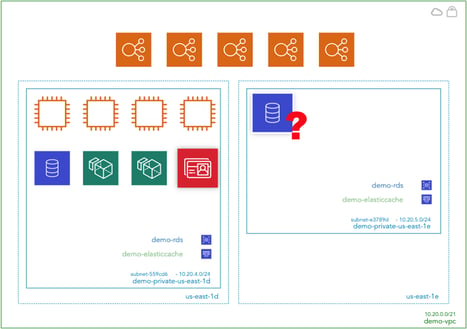
While diff diagrams are super helpful in diagnosing changes after the fact, you may want to keep on top of changes as they happen.
Hava's architecture monitoring alerts will let you know the minute a change is detected. You simply nominate the environment you wish to monitor and add a group of recipients to receive the alerts. When a change is detected like the addition or removal of a resource, Hava will send each recipient a diff diagram showing the changes.

Now you and your security team can be across every change as it happens so you can assess and take action if required.
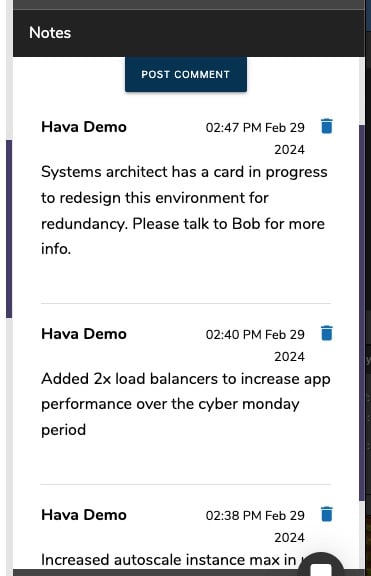
For every architecture diagram generated you have the ability to add text comments. This serves as a rolling dialogue your team can contribute to that may better explain elements of the diagram or bigger picture concepts related to the diagram.
Notes are accessed from the accordion menu within the attribute pane.
New notes are added to the top of the list so they are stored in chronological order.
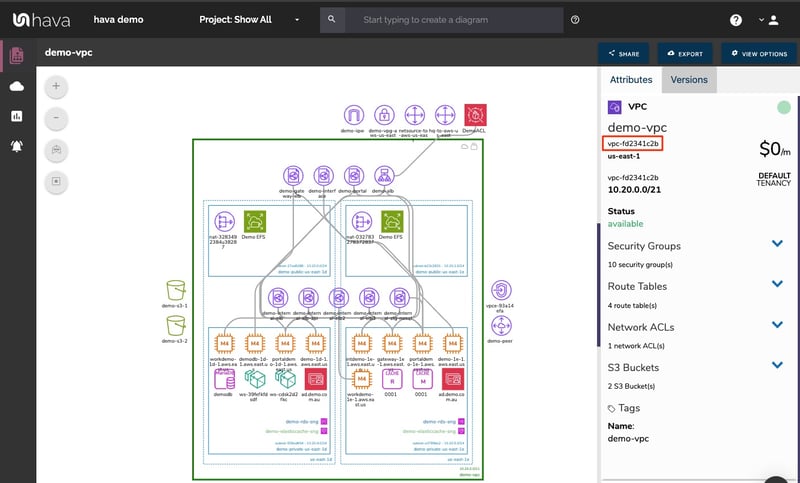
One of the most unique diagrams produced by Hava is the security view. This report lays out all of your security groups and then overlays open ports.
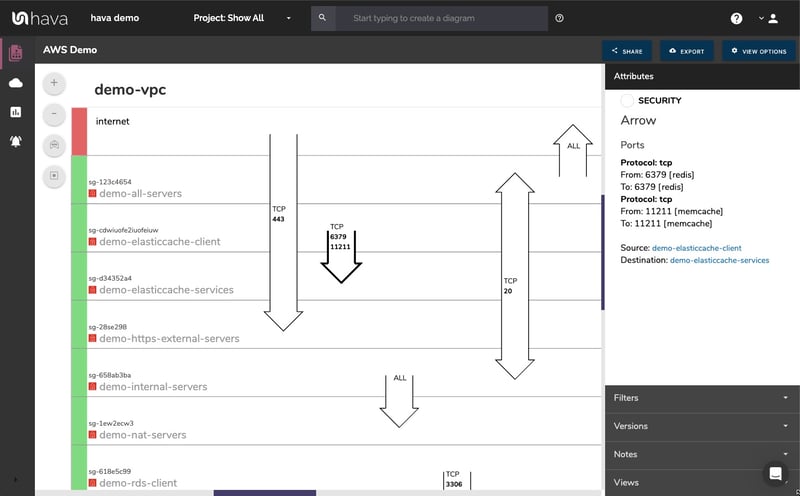
This visualization immediately highlights how traffic enters and exits your VPC so your security team can tell at a glance whether all the ports that need to be locked down are configured correctly and that no ports opened during the development and testing phase have been left open by mistake.
Each security group can be selected on the interactive "diagram" to reveal an attribute pane on the right hand side that shows all the resources connected to the security group.
Hava is a flexible diagramming solution that extends way beyond the diagrams created within the application. The API can be used to integrate documentation within your build pipelines.
One example is the use of the Hava API in a Terraform/Buildkite was published by David Brenecki from Servian who demonstrated how he integrates animated GIF Hava diagrams as artifacts in this Medium Post.
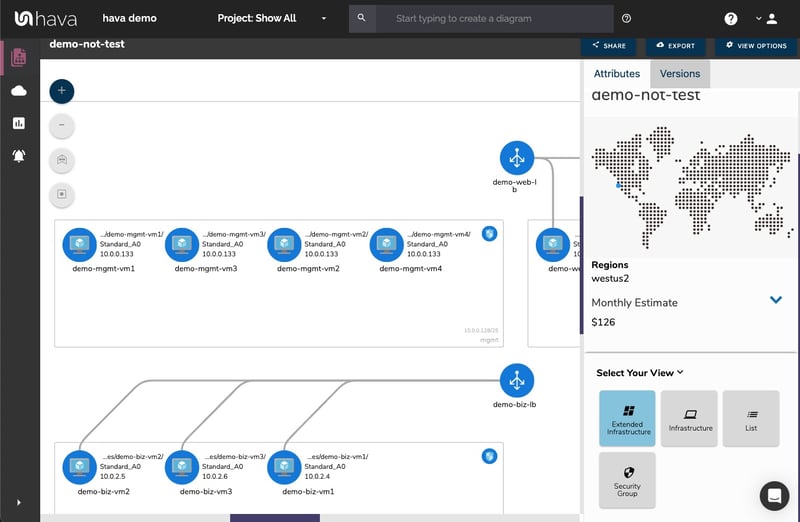
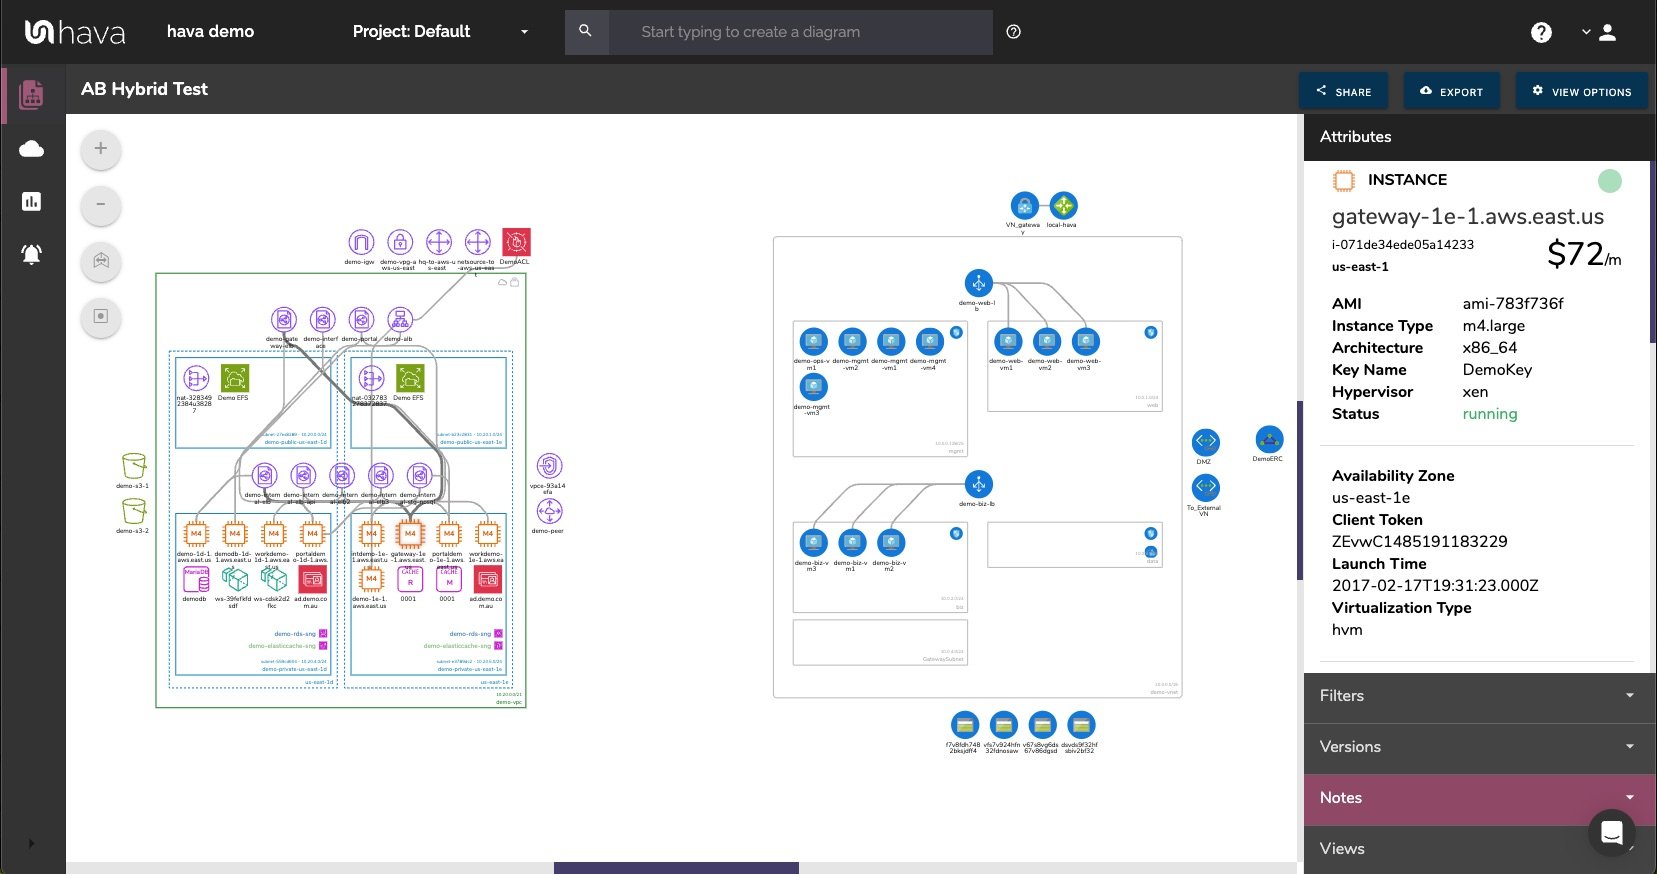
When you need to display your network infrastructure for a presentation or management meeting, using a clean well laid out infrastructure diagram can easily convey what you have configured and running.
Hava keeps your diagrams clean and legible by only drawing essential resources, names and connections on the diagram. All the metadata, associated resources, ports and resource type information is displayed in the contextual attribute pane on the side of the live diagram. This ensures the diagram is not overrun with text and data, which makes for a more visually appealing diagram.
You can then export your diagrams in PDF and JPG formats for inclusion in presentations and management reports.
As we have already discussed, Hava continuously polls your cloud configuration looking for changes. When they are detected a new diagram set is produced. This could provide a challenge in keeping track of changes between iterations of your network design if you were to only have access to the current live diagram. How many changes have been made in between the last time you viewed the diagrams and the current state would be difficult to establish.
To solve this problem, every time Hava updates a diagram, it moves the superseded copy to version history. The version history is fully interactive just like the live current diagram, so you can dig into the setttings and connections on previous diagram versions.
This means you have a running audit trail of all your network configuration changes so that you can pull up diagrams side by side for visual comparison or export them to CSV or JSON files for programmatic comparison.
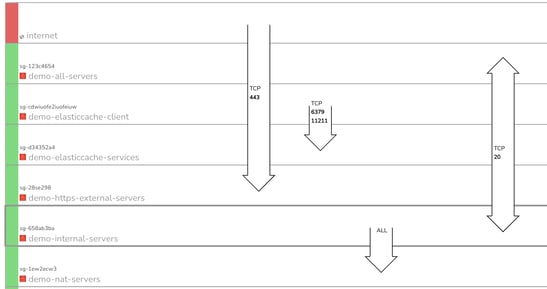
Part of the security regime of any application should be the control and monitoring of how traffic enters and exits your network infrastructure. Establishing what ports are open, what security groups permit ingress and egress and on what IP addresses the access is allowed is an essential governance tool to ensure your cloud network infrastructure is as secure as it can be.
Hava's AWS security view allows you to see at a glance how traffic can enter your VPCs
One of the key cloud governance tasks is to ensure your network is secure and can be recovered in the event of a disaster or unexpected network behaviour.
Hava assists governance in a number of ways:
Having offsite documented details of exactly what was running in your cloud configuration and how the resources are configured and connected allow you a fighting chance of reconstructing your infrastructure as it was prior to the failure.
Most developers we know would much rather use scripts and code to automate the provisioning of infrastructure and it's no different with network documentation. The Hava API allows you to script or use a CLI to interact with Hava.
With the API you can:
With well constructed cloud network topology diagrams you can give any new engineer or external consultant a massive head-start when being introduced to your cloud infrastructure.
Instead of pointing them at your cloud account consoles and getting them to scour the settings and console service dashboards to work out what you are running, you can grant access to your Hava account to reveal exactly what is running and how the resources are configured and connected.
Out of the box, Hava will map out all the discovered virtual networks and VPCs discovered in your AWS, Azure and Google Cloud accounts.
With the adoption of hybrid cloud network design to leverage the individual strengths of each of the platforms the scenario where you would like to generate diagrams with resources from two or more cloud platforms.
Hava allows you to build custom diagrams based on search queries by specifying parameters like tags, source ids, regions, resource types etc.
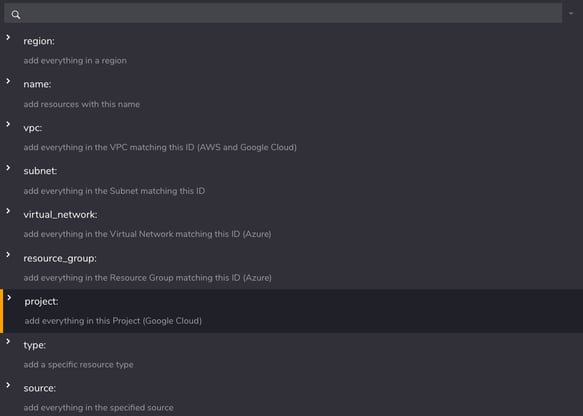
You can combine search terms using and/or operators to build complex queries that allow you to drill down to exactly the resources you want to document.
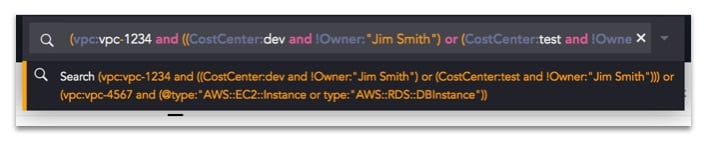
So as well as creating hybrid diagrams, you can also create diagrams from subsets of data. For instance, you could create a diagram of all the databases you have running across all of the accounts connected to Hava, or maybe all the resources tagged as development, the possibilities are endless.
And of course one generated and saved, Hava will keep these custom diagrams updated exactly like the system generated diagrams (including retaining versions)
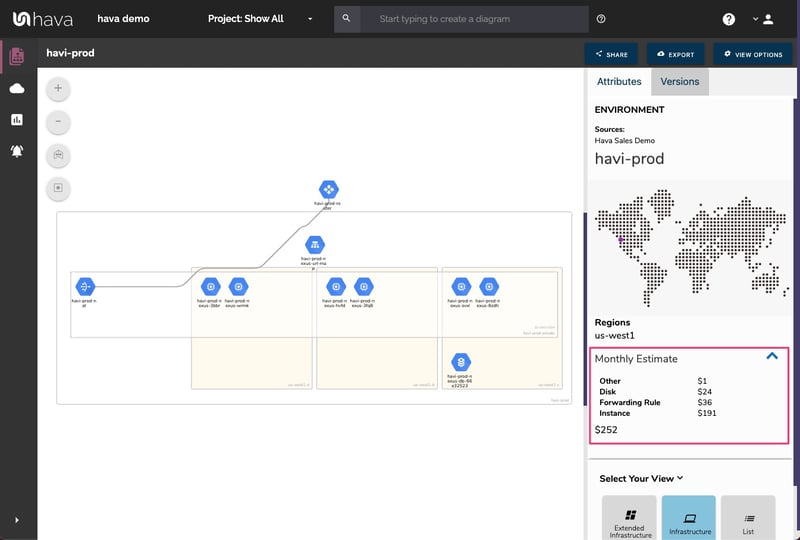
There is another report generated by Hava called the "List View". This report details all the resources that are visualized on your infrastructure diagrams as well as other less important resources like network interfaces that are not placed on the diagrams to keep them readable.
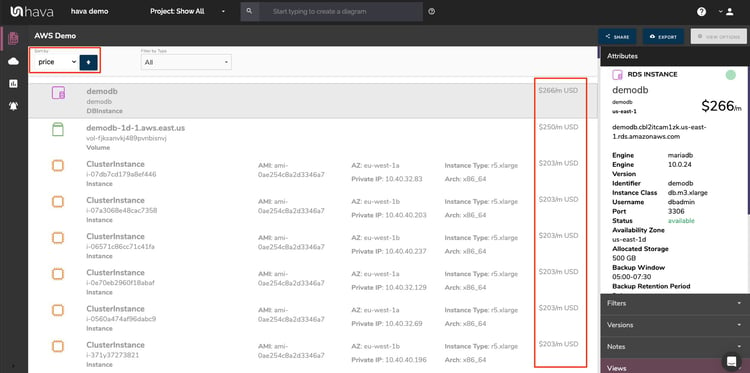
The list view also displays cost estimates alongside each resource and by sorting the list by price, you can surface the most expensive resources in your network.
Exporting the list to CSV gives you a transferable spreadsheet for your management and accounts people.
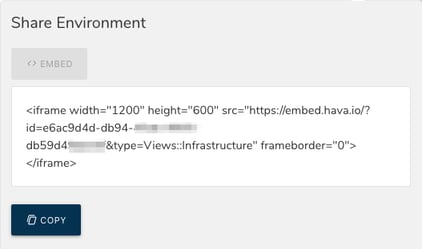
Hava allows you to embed your diagrams anywhere you can place an iframe, so you can view diagrams without the need to be logged into Hava and no plug-ins, special API access or complex code is required.
Typically embedded diagrams are used for:
If you have internal or enterprise security policies that make it difficult for you to connect your cloud accounts to the Hava SaaS solution, you can request a self-hosted version. The containerized Hava deployment is easy to install and keeps the application within your own infrastructure.
So those are a few of the many things you can do when you connect your AWS, Azure and GCP accounts to Hava.

If you would like a demo please get in touch. To try Hava for yourself, there is a free 14 day trial. Learn more here:
Hava's new UI is now generally available. You can switch it on in your personal settings. Give it a go.
Version 2.1.522 of Hava self-hosted is now available. Containing a range of new services, diagrams and performance improvements, we recommend...
You can now integrate Hava diagram creation when you deploy environments using Terraform. The Hava Terraform Provider is now available on the...