aws
Diagrams for Cloud Architecture Security
Diagramming your AWS or Azure Cloud security posture is always a good idea and can highlight vulnerabilities that are hard to spot using just your...
![]()
It's no secret that cloud infrastructure can be complex and ever changing beast. Keeping track of changes intentional or otherwise can be difficult.
When you undertake a new project and create a program of work, the progress made by your developers is usually demonstrable and easier to track through the project lifecycle. You can see the new features, see the changes to the application and see the new app capabilities as the dev work is deployed.
What is not so obvious are the changes going on behind the scenes. Since the evolution of cloud, DevOps and SRE, a lot of change happens as a result of development sprints and digital transformation executed via infrastructure as code or manual cloud updates. These are a lot harder to appreciate and understand unlike application code that is visible on a user's screen. If anyone ever tried to explain a Terraform script to you in a retro, you'll understand.
That's not to say the infrastructure work involved that was required to support the application isn't equally important. More likely than not, that work will have implications, like ongoing costs, extra security considerations or new maintenance tasks.
Being able to demonstrate these material changes to infrastructure during a product showcase, a presentation to your organisation, a handover to a client or a dev team retro is always beneficial. Where infrastructure has changed and your team spent time making those changes, there will be people at all levels keen to know what work went into that change and what the infrastructure changes may mean in terms of impact on costs, ongoing team requirements and exactly what the infrastructure looks like now.
Getting to grips with infrastructure changes can be a time consuming business and sometimes it's easier to not do at all.
If you are proactively wanting to demonstrate infrastructure changes as they are deployed, you might be writing diff scripts to run against the new and old terraform code, or maybe you are clicking around the cloud consoles attempting to explain complex scenarios, or worst case, you get the whiteboard out and announce a presentation.
Then of course the ignore option is ever present. But this leads to engineers or consultants doing a whole heap of work in the future not really knowing what they are dealing with, what's changed and how those changes impact the task at hand. Probably one of the fundamental reasons DevOps came about was to improve the level of communication between dev and ops, so that everyone can see what is going on and what everyone else is doing.
Up until now getting to grips with infrastructure changes, especially on large complex projects would rely on in-depth complex conversations and the developers digging into the IaC code to truly understand the changes during a project, release or build.
To better understand what you have running, what your teams are working on, what's changing on a daily basis and what impact that has, you can leverage Hava to help understand what you have going on. This is particularly useful for MSPs that have clients undertaking development on cloud environments they manage.
When you manage, inherit, redesign or start a new project establishing exactly what is running at the beginning is an essential first step. Recording the current state of the infrastructure so you can document it and maybe assign a project revision number gives you a reference point to compare back to.
It also gives you a clear starting point to base your work on. Of course this can be tedious time consuming work which, depending on the size and complexity of the infrastructure can take days or weeks to complete unless you can automate the discovery and diagramming process.
This is where Hava steps up to the plate.
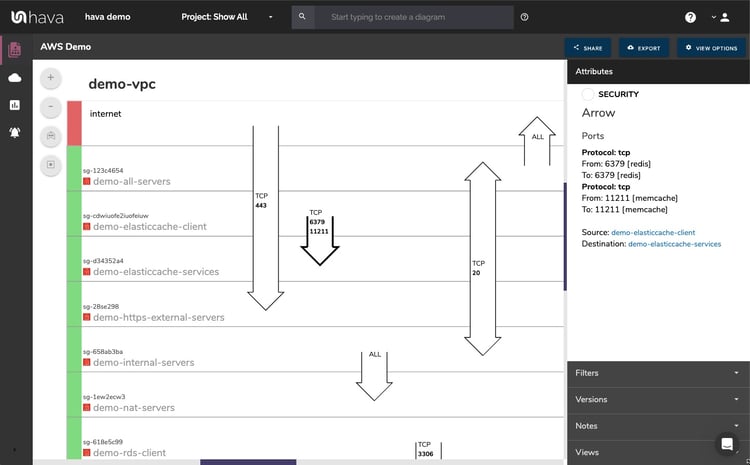
By connecting the cloud accounts hosting your project, Hava will generate infrastructure and security diagrams showing all of the VPCs and virtual networks running on those accounts for AWS, Azure and GCP. This gives you a detailed picture of everything running.
You project may well be a small subset of the organisation's infrastructure. In which case you can use Hava's custom search function to build a diagram from criteria you nominate, like specific tags. All the resources for your project if tagged correctly will appear on the diagram, irrespective of which cloud vendor or cloud account they are running on.
This diagram once saved continues to be updated automatically when synced in the background by Hava or triggered by an API call or GitHub action.
Now your baseline is established, there are a couple of things you can do to ensure your changes are captured in documentation as they are deployed.
Hava syncs your environments periodically depending on the plan tier or configuration. This can be anywhere from weekly to hourly. Syncs can also be manually triggered when you have rapid deployment happening and want to see the changes.
Using the GitHub action provided by Hava, you are able to trigger a sync with GitHub and also capture the new environment diagram into your GitHib documentation repo as you push changes affecting infrastructure.
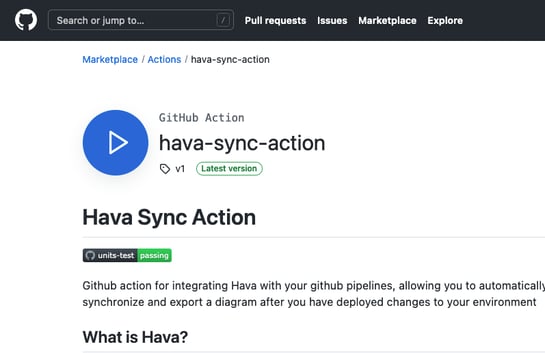
This ensures you can track infrastructure changes through the development cycle as new resources are added, removed or re-engineered for the many reasons that drive that change.
But how do you know when your dev team or client has pushed infrastructure changes so you can review and assess the impact? It's always better to know as things happen rather than having to field awkward questions from a client or finance when the AWS bill arrives.
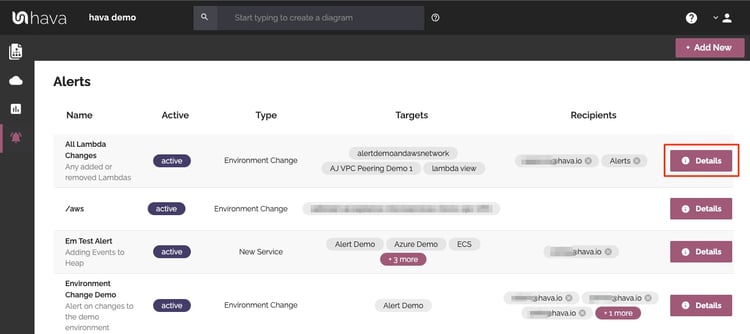
Hava's built in Architectural Monitoring is the answer. Alerts can be set up against different environments including custom built ones based on tags.
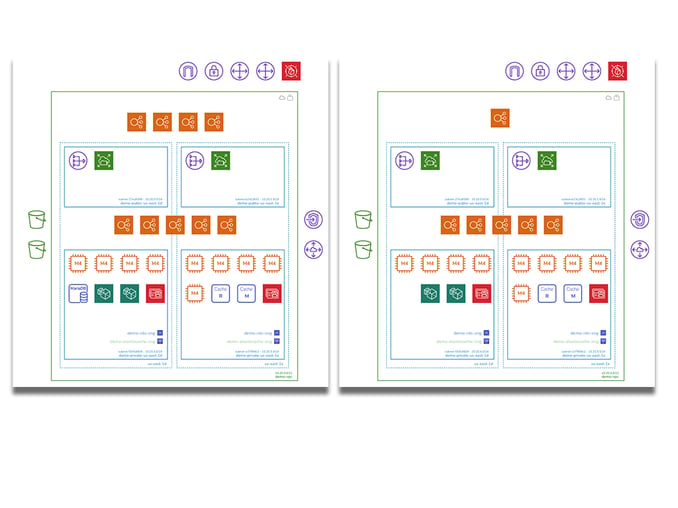
Once a change is detected in a monitored environment an alert is triggered which captures a diff diagram in the Hava alerts console and also emails nominated recipients via email.
This means you get to know about infrastructure changes as they happen. So even if you don't have access to the client's GitHub repo, you can still monitor changes and spark conversations around costs, scale, security or design choices as the alerts come through
Showing customers or your team what is running or what has just been built is always a good idea. Especially if you can present the information where they hang out all day.
The "as built" base diagrams showing infrastructure and security as it was built and then revisions as the infrastructure evolves clearly communicates to your team or customers what they have running and what those resources are likely to cost.
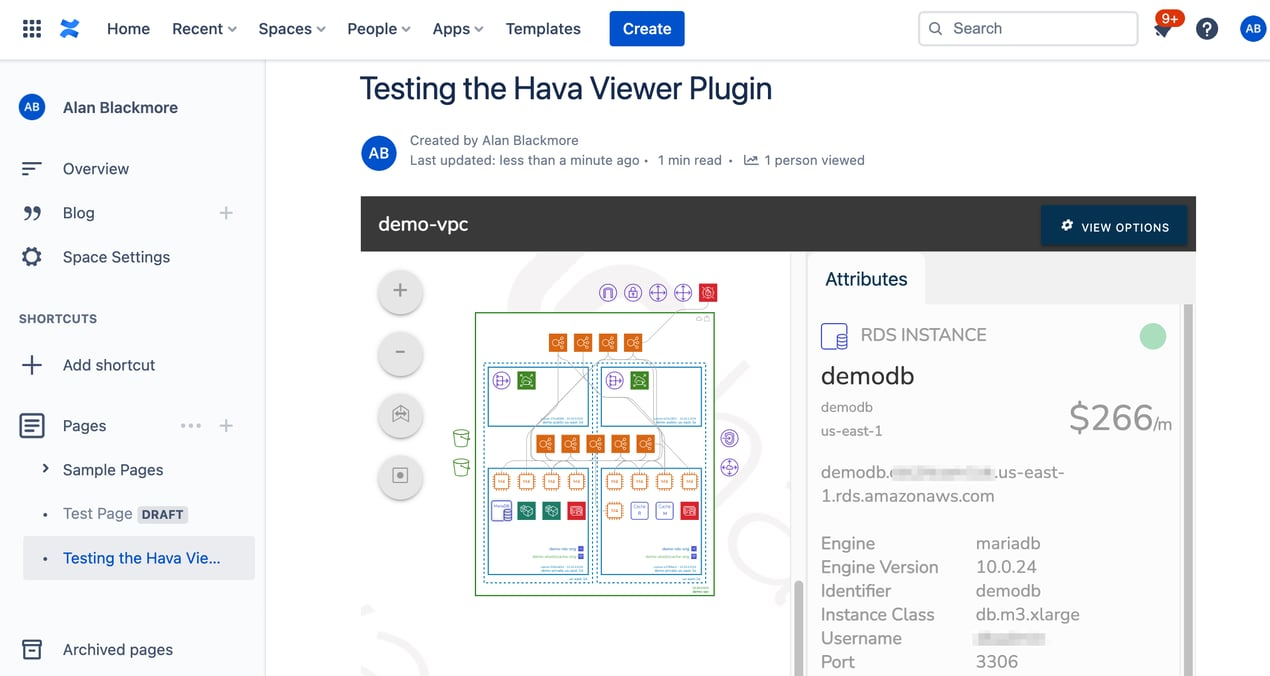
Placing Hava diagrams into a client Wiki enables the clients to see the information they need to see without needing access to your Hava console. If that Wiki is Confluence, you can use the Hava Confluence plug in to do this easily. By embedding the live interactive environment diagram into their confluence pages, they can investigate resources and view estimated costs overall or on a per resource basis.
If your client is using another web based intranet or web property then you can use the iFrame embed code snippets provided by Hava to do the same.
When you are responsible for cloud infrastructure you are probably torn between what changes you allow teams or clients to make and keeping environments constrained within the scope of your management terms.
It's a lot easier to give engineers free reign when you have Hava's architectural monitoring in place. You can effectively let them go for it while you observe from the side lines.
That's where stage 4 comes into play. With alerts in place and diagrams updating automatically, you are always in the loop. When an engineer deploys a massive database instance you weren't in the way stopping it from happening, but now you know about it via an alert and can notify the client to expect a bump in costs this month, or you can query the dev team involved to see if the additional spend was intentional.
You can also let the security team know that things have changed and they need to sign off on the config.
Either way you'll be in a position to act quickly almost the minute new infrastructure resources are added or scaled out.
While it is straightforward to diagram an entire environment, capture changes, send alerts and automate that process with Hava by simply connecting your cloud accounts, you can reach an even deeper understanding of changes and work done by specific teams or consultants on segments of infrastructure by leveraging tags.
When you tag resources, you can use Hava's unique yet powerful custom query diagram builder to find and diagram those resources. You can use tags to attribute changes by an individual or team to specific resources. This can be used to flag resources at a project level, department, version, or team, the list is endless. Building visualised infrastructure diagrams by tag, you can span multiple environments, cloud vendors and even cloud accounts to find what you are looking for or to keep an eye on a specific project, team or outcome.
Once you create a custom diagram from a tag (or tags) and save it, the diagram will continue to update automatically. As new resources and even entire VPCs are added with the same tag(s) they will be added to the diagrams with the superseded diagram being sent to version history. Older versions are also interactive so you are able to investigate and view all the settings and metadata related to the diagrammed resources and infrastructure.
Now, every single product owner has the ability to ensure that they're not just presenting on the changes made at a coding and application level, but they have context and clarity themselves and that they can provide to the team details about what's changing in the cloud architecture and where that time and points have gone in a sprint.
Using Hava every organisation from MSPs and Professional Services, consultants and in-house development teams can establish what infrastructure they have running, get alerted when things change and can review before and after diagrams at any point in time from entire large environments down to very specific resource subsets.
Often, the efforts of your DevOps and cloud engineers is only seen through the very end result, which is uptime and scaleability. But, it can be much more rewarding for your teams to be able to demonstrate their efforts across the board and of course having infrastructure clarity across the board has untold benefits for your organisation.

FAQ:
Q: Is there a tool to visually monitor what a consultancy or MSP is doing in my environment?
A: Yes - Connect your cloud account to Hava to monitor with diagrams and get alerts when things change.
Q: How can I see cloud configuration changes during application development?
A: Use Hava to visualise infrastructure and security
Q: Can I record the actual changes made after signing off on the change request
A: Yes, once Hava is connected, all the changes are auto updated onto the live diagrams, with previous versions being retained for comparison purposes
Q: I've got multiple projects on the go spread across multiple cloud vendors. How can I monitor all of them?
A: There is no limit to the number of cloud accounts you can connect to Hava. You may also create project specific diagrams based on tag pairs (ie: Project: "Ecom" ) which may have components spread across multiple clouds. As long as the cloud accounts are all connected to Hava you'll get comprehensive project diagrams that self update and can alert you when that project infrastructure changes.
So maybe you are in Professional Services and need to track infrastructure changes during a project to clearly communicate that back to the client, Hava can help.
Or you might have a complex application with infrastructure spread across multiple clouds and you need to monitor tagged resources or entire VPCs as they are rolled on to the project, Hava can help.
Maybe you are an Operations Manager and need to keep an eye on infrastructure in the project Wiki page in case cost or security questions need to be asked, Hava can help
Or perhaps you manage ITSM and need to provide context around all these resources in your CMDB. You may also want to create an architectural decision record and include diagrams showing the updated infrastructure. Hava can help with that too.
As a product owner you might like to liven up your next sprint showcase with visuals demonstrating where the DevOps and cloud engineering effort has gone. Clear diagrams lets everyone know and also provides clarity for the next sprint. This also provides your team the opportunity to raise issues with the changes faster.
You might like to speed up the handover process by providing as built documentation to Ops to ensure a smoother and more responsive move to production. Hava has you covered.
So whether you just want to visualise your cloud infrastructure via clear concise interactive diagrams, or you want to monitor and record changes through your entire cloud eco system, you can use Hava to get that job done.

Try it out for yourself with a 14 day free trial:
Diagramming your AWS or Azure Cloud security posture is always a good idea and can highlight vulnerabilities that are hard to spot using just your...
Monitoring cloud architecture is an essential part of modern IT operations. There are lots of tools and applications that can help. In this post we...
When you operate cloud infrastructure within strict compliance or governance parameters, it is nearly impossible to automate cloud diagramming and...