aws
Automated AWS Diagram Generation: Simplify Your Cloud Diagrams
Simplify your cloud diagrams with hava.io’s automated AWS diagram generation. Explore, monitor, and track changes in your cloud infrastructure with...
Keeping track of dynamic Google Cloud Platform environments can be a difficult, time consuming and costly exercise.
As Google roll out new features and services, the chances of your GCP environment configurations remaining static for very long are less now than they have ever been. Add the dynamic nature of resources like autoscaling managed instance groups and the task of keeping tabs on exactly what you have running and where is an ever increasing challenge.
Well documented GCP networks are a lot easier to understand and explain to new engineers and external consultants. In these days of ever increasing compliance burdens and strict governance rules, keeping on top of your network topology is more critical than ever.
Having accurate cloud infrastructure diagrams is a massive time saver when on-boarding new engineers or establishing the state-of-play when you take on a new client or project, that goes without saying. However one of the less obvious uses for up to date diagrams is proving to compliance auditors and insurance assessors that all your systems are in order, your security is locked down and the data you are retaining is appropriately secured.

When a change in application performance occurs or your application experiences a complete outage you need to find out the cause as soon as possible. If you have up to date network topology diagrams that you can compare to the state of the network now and the state of the network prior to recent changes, you have all the information you need to track the changes in your GCP environments.

Keeping up to date diagrams in the past has been an extremely time consuming task, especially in large organisations with hundreds of cloud accounts and multiple teams potentially changing environment settings on a daily basis. Having to update diagrams manually every time you modify a setting, add an extra NAT Gateway or Database Instance isn't high on anyones list of priorities.
That's why having a system that continuously polls your GCP configuration and automatically updates your diagrams while at the same time archiving the previous diagrams and config settings into version history is not only smart, it's also fundamental from a diligence and effective governance perspective.
The versioning feature of hava.io has this functionality built in. Hava will automatically sync your config data then continuously monitor to snapshot any changes to your GCP environments.
This gives you a complete audit trail by frequently polling your console settings and detecting exactly what has changed in your cloud config. Changes are made to the current diagrams and the superseded diagrams are placed into a fully interactive version history.
This means, you can pull up the current infrastructure diagram along side your choice of superseded diagrams and compare resources and the individual metadata and settings which may help to quickly identify the changes that have caused any performance or outage issues.
When viewing your GCP network topology diagrams, versions are available in the right hand attribute pane
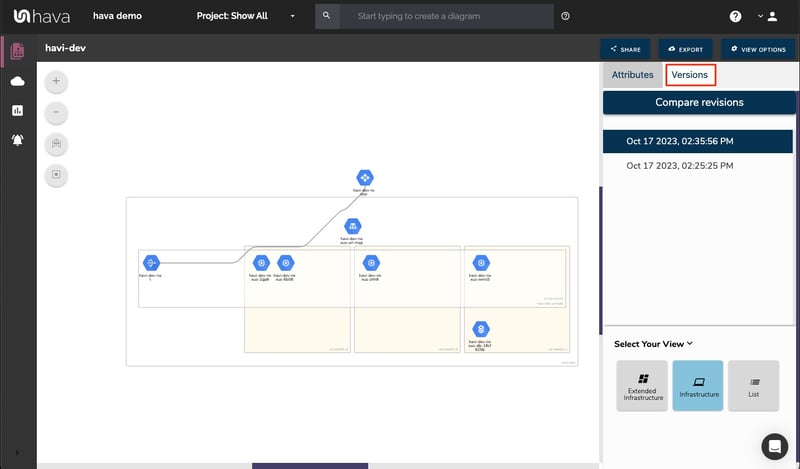
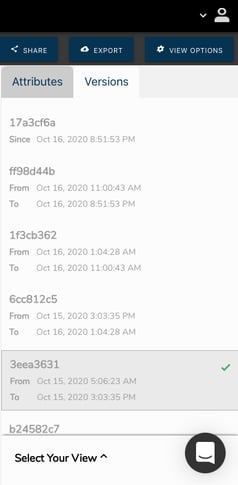
When you select the versions tab, all the recorded versions are displayed in a list. Each version has a "from/to" date that tells you when that particular version became live and the date/time that it was replaced.
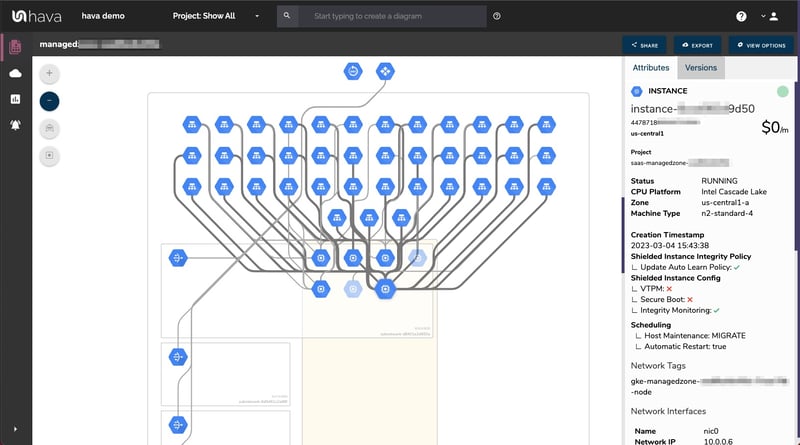
The GCP infrastructure diagram automatically generated by Hava are interactive. You can select individual resources like a DNS managed zone, URL Map, Memory Store or Compute Instance and the attribute pane to the side of the diagram changes to display the metadata related to that attribute.
If you have massive environments with thousands of resources, then visually identifying differences may be problematic in which case you can export your environment in JSON format using the Hava export function and then you can open an older version in the versions tab and export that so you can "Diff" the two JSON files to identify the changes. This will surface new or missing resources and settings that have changed between the two versions.
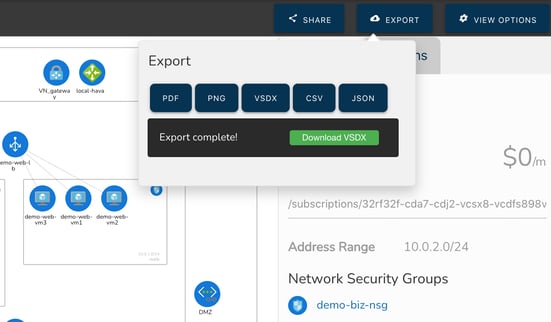
You can also export your diagrams in PDF or PNG formats for inclusion in presentations. There is also a VSDX format export so you can open up the diagram in Visio or draw.io for editing and annotation. Hava does not include an edit function to keep the native diagrams accurate and in line with reality, which preserves the integrity of the generated diagrams for audit purposes. The VSDX export is ideal as a starting point should you want the existing network diagram as a starting point for redesign or proposal purposes.
With Hava automatically tracking and documenting changes to your GCP environments, you always have up to date network diagrams and an audit trail of all the changes that occur. A completely hands free automated way to track changes in all your GCP environments.
Hava also supports AWS and Azure and provides that same ability to auto generate diagrams, detect changes and update diagrams when changes are detected by simply connecting some read-only credentials to Hava.

You can take Hava for a free 14 day trial, learn more using the button below.
Simplify your cloud diagrams with hava.io’s automated AWS diagram generation. Explore, monitor, and track changes in your cloud infrastructure with...
You can stop wasting your valuable time manually drawing your AWS network topology diagrams using this fully automated diagram maker. Find out how...
A good AWS Diagram is the foundation of understanding how your cloud infrastructure is configured. It's never been faster or easier to generate AWS...