aws
Generate Amazon AWS Architecture Diagrams
When you auto generate AWS architecture diagrams, visualize security configurations and create new versions automatically every time your network...
AWS availability zones are on the whole extremely robust, however they are not completely immune to outages. Geographically they are subject to natural and technical disasters that can affect any data center, like floods, prolonged power outages, fires or someone inadvertently slicing through a fibre optic cable.
Cloud providers like AWS divide their network infrastructure into large geographical regions like US-East, US-West, EU Ireland, EU Paris, Africa Cape Town and so on. These regions are then split into independent availability zones (AZs) which are separate data centers and are geographically close to each other. The AZs that make up a region provide similar latency so are viewed as identical parts of a region.
So what happens to your network or application when an AZ drops out, will it persist or will the house of cards come tumbling down. A recent outage of an AWS US-East availability zone took down several high profile sites like Slack and streaming service Hulu which demonstrates even the best companies with huge teams don't always get it right.
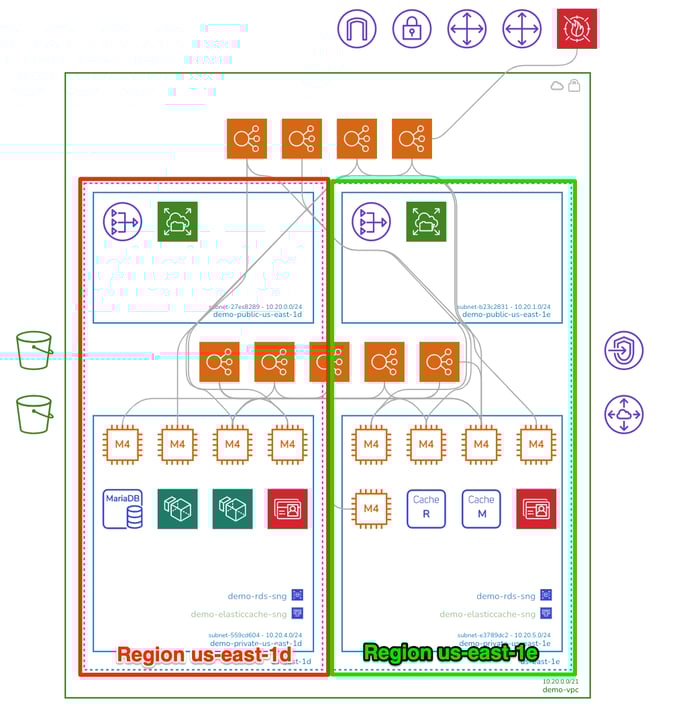
Visualising your network topology with resources laid out in the availability zones they are running in is a massive head-start in understanding what would happen if an AZ disappeared. The running resources contained within the visualized AZ will be the ones that go offline, so you can see at a glance whether your application will persist using replicated or load balanced resources hosted in an alternative availability zone.
Some cloud resource functionality will manage the placement across multiple AZs automatically. For instance, if you create S3 buckets in a specific region, AWS will spread data across multiple availability zones to ensure it can be served faster and is highly available.
Other services need to be managed in order to provide application redundancy in the event of a zone outage. Auto scaling groups for example, can be configured to deploy compute instances across multiple AZs within a region. In the rare event that an AZ drops out, your ASG will scale out compute instances in the remaining zones to keep your application running.
Another challenge is accessing data. Whether you are using EBS volumes (Elastic Block Storage) or AWS RDS databases which utilise EBS volumes, the data only resides in a single database instance in a single availability zone. To ensure your databases are available during a zone outage, you should replicate them in a second or multiple availability zones so the data is accessible during the outage.
Viewing the Hava infrastructure diagram above, we can see that if us-east-1d disappears, so does the database. This is immediately apparent once the infrastructure is visualised. Recognising this vulnerability is a lot tougher when you are just relying on the AWS console.
Hava lays out VPC diagrams by availability zone specifically for this purpose, with all the discovered resources and subnets being placed into columns representing availability zones.
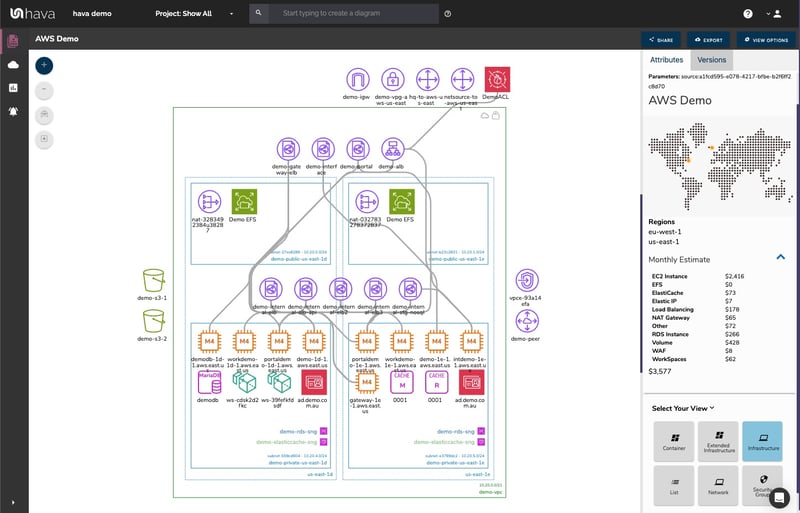
The infrastructure diagram that shows your AZ columns is interactive. By selecting a subnet, az, vpc or individual resource all the information related to the selected item is displayed in the attribute pane to the right of the diagram. All the metadata and settings related to the selected resource appears in the panel, this includes estimated cost, names, versions, Ips, security groups, ports, tags which usually means you don't need to swap out to the AWS console in order to find out more about the visualised resource.
On top of the ability to visualise zone outage vulnerabilities and how your network hangs together, Hava also provides security groups visualisations. Your security groups are laid out and the traffic rules and ports are visualised as arrows showing you the source and destination of the traffic (ingress/egress) and the protocols related to the configured ports.
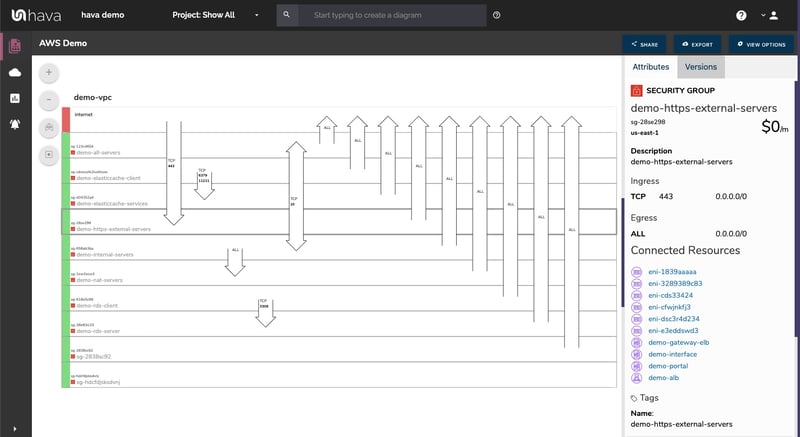
So again, at a glance you can tell exactly what is going on and immediately spot any outliers or ports that may have been opened by mistake.
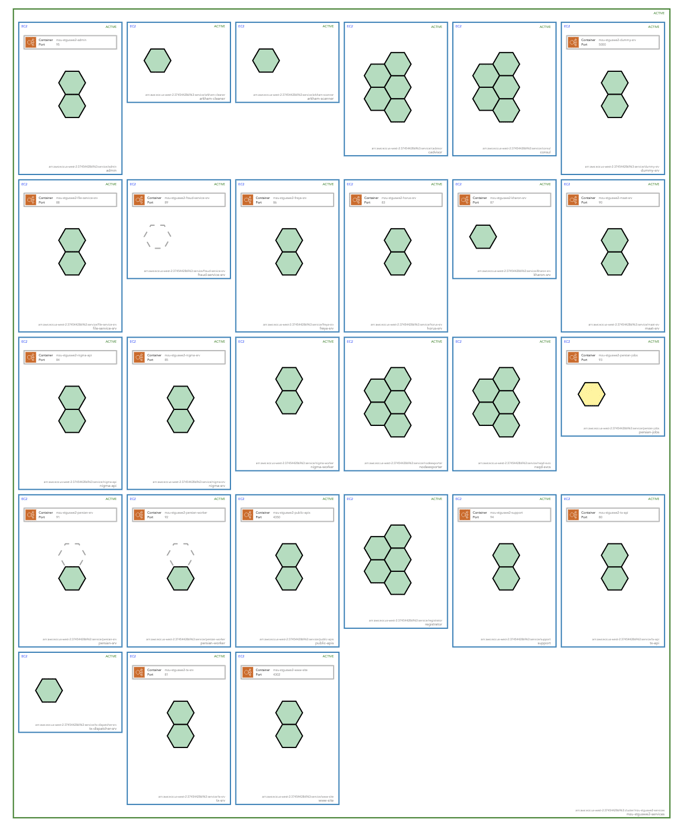
On top of AWS infra and security, Hava will also detect your ECS workloads and visualise the containers and the status of individual worker pods so you can tell at a glance what is running and what workloads may have issues.
If you are not using Hava yet to visualise your AWS, GCP, Azure or Kubernetes clusters you can use the button below to access a free 14 day trial.
Give it a go, connect your AWS account and find out in a few minutes if your application would persist during an availability zone outage.
Learn more here:

When you auto generate AWS architecture diagrams, visualize security configurations and create new versions automatically every time your network...
When you auto-generate AWS diagrams, visualize security configurations and create new versions automatically every time your network changes, all...
The quickest way to create a GCP network infrastructure diagram is to connect to Hava. Simply attach a Service Account and Hava auto generates...