aws
Cloud Architecture Diagramming by Hava
Master cloud diagramming with our in-depth guide on visualization best practices. Explore how Hava.io automates and elevates your cloud architecture...
Cloud security is a critical concern for organizations that rely on cloud-based infrastructure and services to store, process, and transmit sensitive data. One key aspect of maintaining effective cloud security is regularly conducting security audits to identify and address potential vulnerabilities and risks.
One effective tool that can help cloud security teams during a security audit is visualizing cloud security using diagrams. Diagrams can help teams clearly and concisely communicate the current state of the organization's cloud security, identify areas of concern, and plan for necessary improvements.
There are several types of diagrams that can be useful for visualizing cloud security for AWS and Microsoft Azure. For example, a network diagram can help teams understand the relationships between different components of the cloud infrastructure and how data flows between them. This can be particularly helpful for identifying potential points of vulnerability, such as unsecured connections or insufficiently protected data transfer points.
Another useful type of diagram is a security architecture diagram, which shows the different layers of security controls and how they are implemented in the cloud environment. This can help teams understand the overall security posture of the organization and identify any gaps or weaknesses that need to be addressed.

Diagrams can also be helpful for visualizing the process of conducting a security audit itself. For example, a flowchart can outline the steps involved in the audit process, including tasks such as data collection, analysis, and reporting. This can help teams ensure that they are covering all the necessary bases and that their audit is thorough and comprehensive. Ok ok there is a use case for manual flow charts in this instance.
In addition to being useful for internal purposes, diagrams can also be a valuable tool for communicating with external stakeholders, such as customers or regulatory bodies. By clearly and concisely visualizing the organization's cloud security measures, teams can demonstrate their commitment to maintaining a secure environment and provide reassurance to stakeholders that sensitive data is being properly protected.
In summary, visualizing cloud security using diagrams can be a powerful tool for cloud security teams during a security audit. Diagrams can help teams clearly understand the current state of their organization's cloud security, identify areas of concern, and plan for necessary improvements. They can also be useful for communicating with external stakeholders and demonstrating the organization's commitment to maintaining a secure cloud environment.
So what is the easiest way to visualize your AWS or Azure security? It's probably not a surprise, but we think Hava has your security visualization needs covered. Not only do you get to see your security group and traffic ingress/egress on an easy to understand diagram, but you get the diagrams automatically generated by simply connecting your cloud account to Hava.
This can be either the online SaaS version, or if your organisation is tightly restricted, you can deploy a self hosted version of Hava on your own infrastructure behind your own security.
Connecting an AWS account to Hava will yield a security view for each VPC discovered.
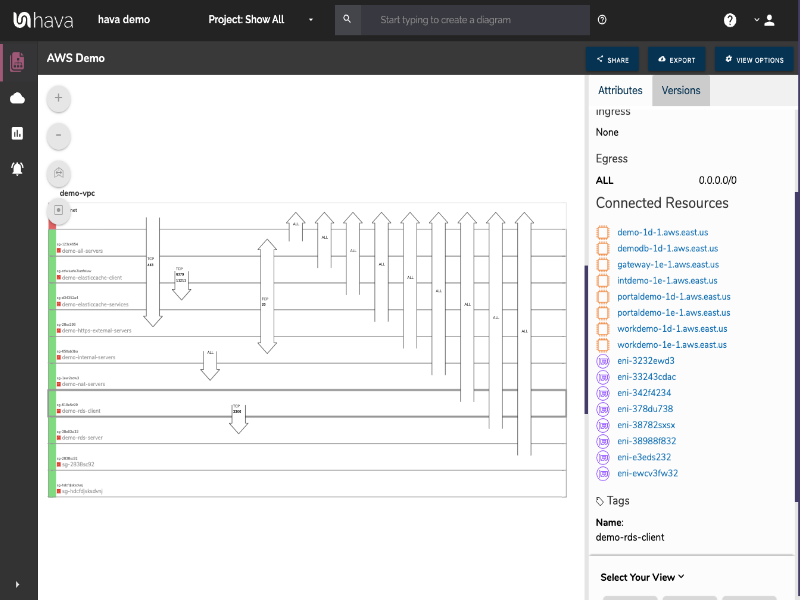
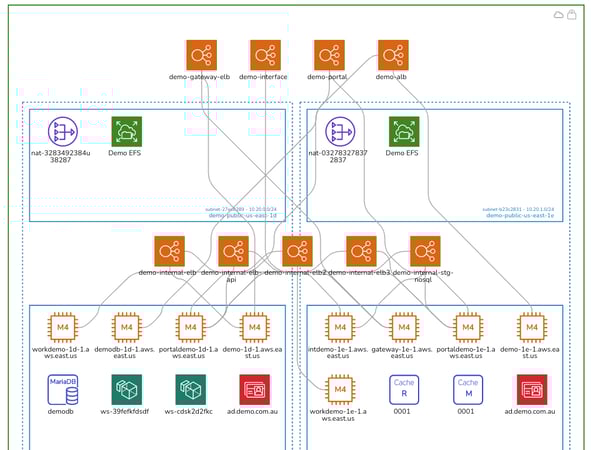
When you look at the standard infrastructure view built by Hava, you get to see your network gateways and the availability zones, VPC's and subnets that are present and the connections between the gateways and individual resources.
The above security group diagram comes at the network configuration from another angle. The diagram lays out all the discovered security groups and overlays the ports and traffic ingress / egress details that traverse the VPC.
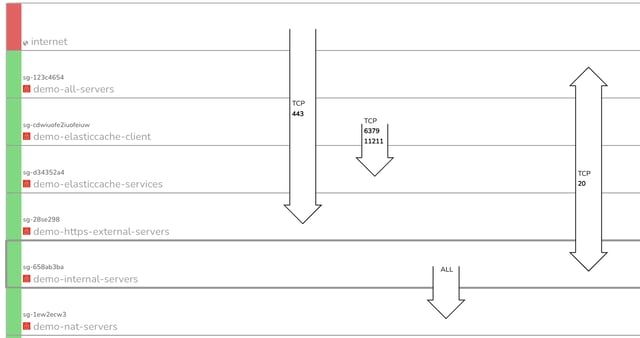
Whether you are freshly qualified security graduate or a battle scarred senior security consultant, the ability to immediately see all your ports, traffic and potential vulnerabilities on one diagram is incredibly useful.
When you view the Hava AWS security diagram, at a glance, you can see whether the security has been configured in line with your cloud security architect's intentions and that nothing has been missed or left vulnerable.
On the above 'demo' AWS environment you can immediately see port 443 is wide open.
On this AWS security architecture diagram, you can see all of your security groups stacked on top of each other. These security group rows are interactive. If you can see an open port and want to know what resources are governed by the security group, all you need to do is click on the group and the attribute information pane to the right of the diagram changes to display that information.
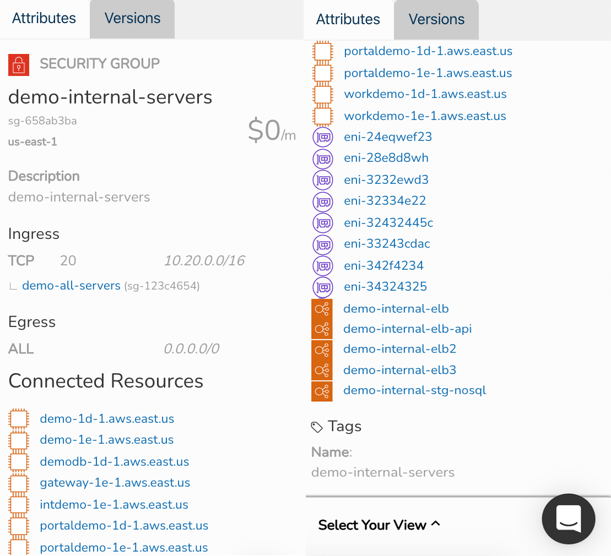
If you select the "Demo-Internal-Servers" security group on the above diagram for instance, the attribute pane metadata on the right habd side changes. Now we can see specific details about the group like:
Most of these resources in the attribute pane are also 'selectable', so you can drill into each resource from the security attribute pane should you need to, without leaving the security group view diagram. There's no need to flip flop between consoles and the diagram to find out what is going on.
If you are responsible for cloud security group frameworks as part of a cloud security solutions offering or are a cloud security consultant or engineer, you can probably see how much time you could save adding Hava's security view diagrams to your engineering tool set.
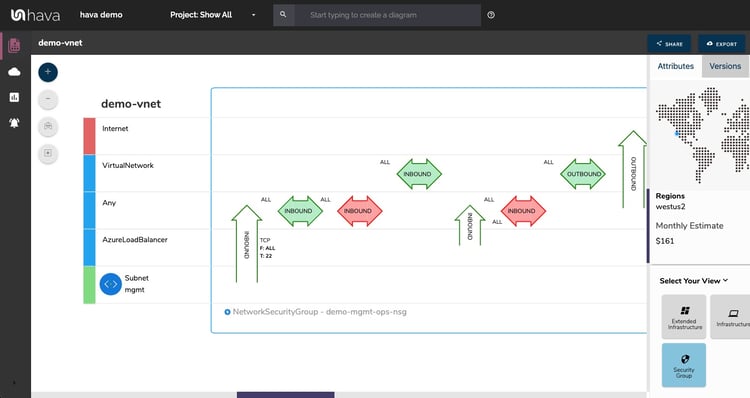
As with AWS, when you connect your Microsoft Azure account(s) to Hava, for each virtual network discovered you will auto generate a diagram like this:
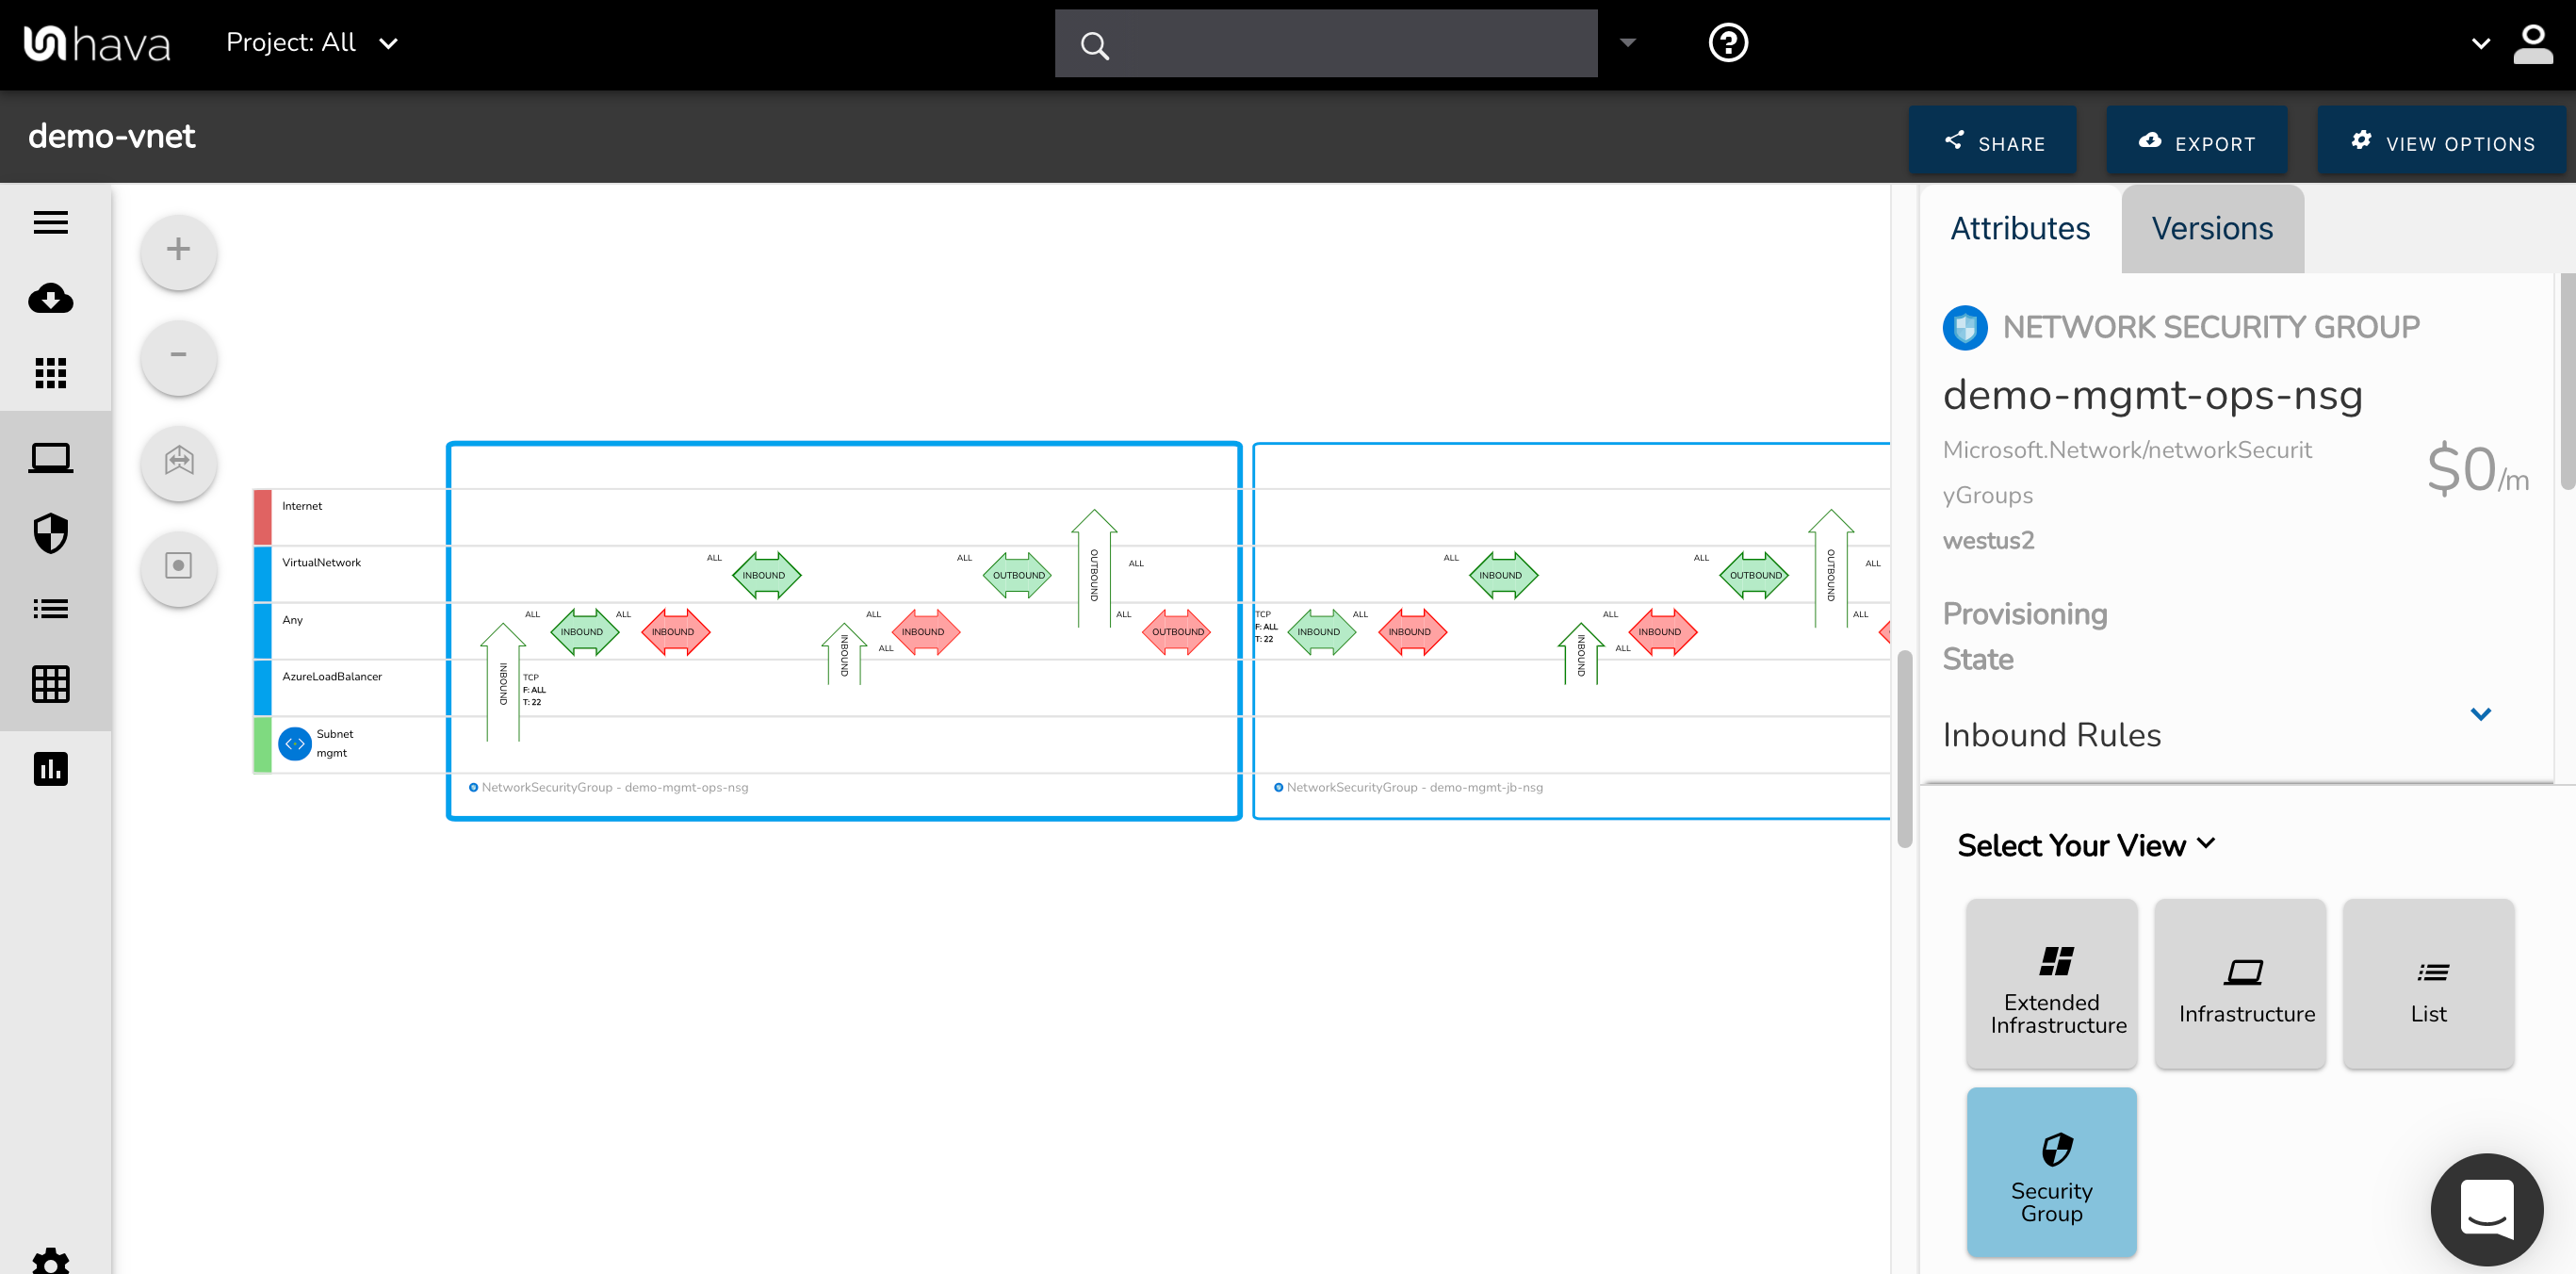
Each Azure security group is represented by the large blue rectangle and the connected destinations shown horizontally. Traffic and rules are represented with arrows with the green and red horizontal arrows displaying inbound and outbound rules, ports, protocols and source/destination and the vertical arrows showing traffic between different sources and destinations.
With a Network Security Group selected on the diagram the attribute pane to the side of the diagram will show :
If you are not familiar with Hava, it is an application that allows you to connect a cloud data source, like an Azure, GCP or AWS account and once connected Hava will scan your cloud config, discover VPCs, virtual networks or container workloads and build an interactive diagram set detailing the resources and security groups discovered.
All automated and hands free - no need for any drag and drop or manual diagramming.
Then once a diagram is generated, Hava continuously polls your configuration looking for changes. Once detected a change will trigger a new diagram set (both infrastructure and security), all hands free, no need to log in or trigger a sync manually.
The superseded diagrams are placed in version history and can be interrogated during an audit or for easier troubleshooting by pulling up older versions of your network and comparing them to the current diagram.
Everything on the diagram is interactive, if you select a resource like an EC2 instance, the attribute pane to the right of the diagram will display all the known metadata related to the instance.
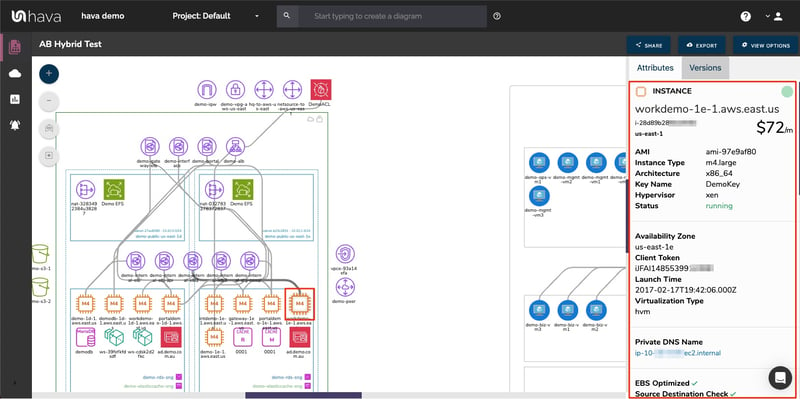
This gives you everything in your VPC on one diagram with the ability to inspect settings and the security stance without having to swap between cloud consoles to dig deeper into what is running and how it is configured.

You can take a fully featured Teams account for a 14 day free trial using the button below or alternatively get in touch to discuss your individual use case and problems you need to solve using automated cloud diagrams.
Master cloud diagramming with our in-depth guide on visualization best practices. Explore how Hava.io automates and elevates your cloud architecture...
When you operate cloud infrastructure within strict compliance or governance parameters, it is nearly impossible to automate cloud diagramming and...
Explore how automated diagramming with Hava enhances multi-cloud management across AWS, Azure and GCP for better visibility and compliance.