aws
AWS Architecture Diagram Tool from Hava
Hava's AWS Architecture Diagram tool automatically generates your AWS Infrastructure Diagrams, hands-free, no drag-and-drop required. Diagrams stay...
When you are working with AWS VPC infrastructure, there are many many reasons why you can benefit from accurate automatically generated infrastructure diagrams.
Visualizing your cloud architecture allows you to immediately comprehend what is running, where it is running and how it all hangs together. Logically laid out diagrams created with an AWS VPC Diagram Generator give you immediate line of sight on what your AWS infrastructure looks like without you having to spend days or weeks trawling through your AWS Console manually constructing diagrams.
Unless you automate, the major problem with diagrams, is that they take forever to draw manually and the second you finish one, the config changes and it's out of date.
It can be a full time job keeping on top of accurate AWS VPC documentation, especially if you have large environments, lots of accounts, or multiple applications that you need to control.
It's a massive time suck! You've got way better things to do, so why would you get bogged down in creating and updating diagrams manually?

If you or your team are like most development or Ops organisations, you work to deadlines. There's new code to push, new features and capabilities to roll out across your infrastructure and management, as always, want it rolled out yesterday. So any time savings you can find in your build pipeline have to be a good thing.
If you're on-boarding a new engineer or consultant, do you talk them through the infrastructure, hand them log in credentials, point them at the consoles and let them work it out, or do you drag out the whiteboard and markers and start drawing?
If you had your AWS infrastructure in diagram form, or better yet, an interactive AWS Network diagram, the mere fact they can visualize the network, see all the VPC's laid out in a logical format, see all the resources, the EC2 instances, the databases, the gateways then the chances are you've just saved hours or days getting them up to speed.
Having interactive diagrams where resources are selectable and you can deep dive into the settings and metadata provide an even faster method for you, your team and new recruits to really understand what your AWS network looks like and how it is configured.
The Hava AWS VPC Diagram Generator achieves this in a few short minutes.
Enter in your AWS credentials by way of a cross-account role, you'll have up to the minute accurate diagrams that reflect exactly what you have configured, where it is running and how its configured in just a few minutes.
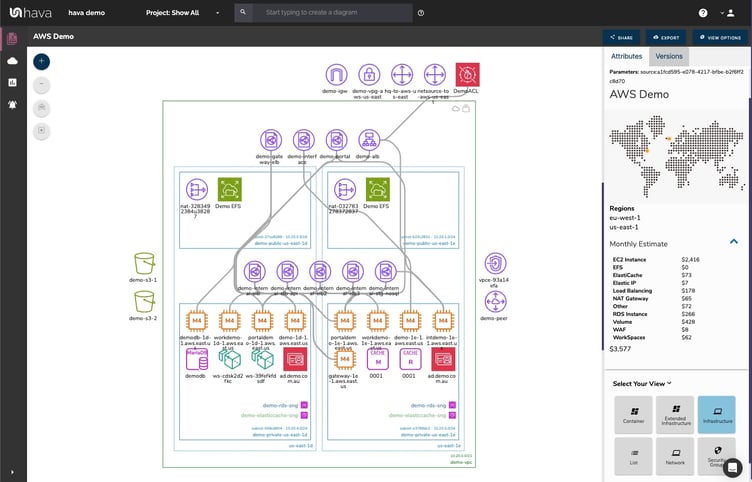
Once connected, Hava fires the AWS VPC Diagram Generator and your Hava dashboard will be populated with all the VPCs you have configured in your AWS account (or Accounts).
You can inspect any of the resources and see all the attributes that relate to it. Where the resource is running, what security group the resource belongs to and what subnet it's running in.
100% accurate infrastructure and security diagrams in seconds, with no drag and drop or trawling through the console.
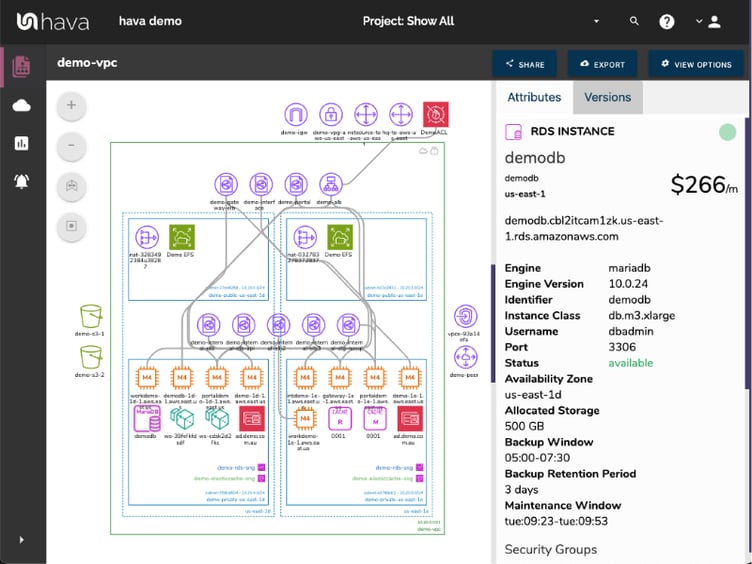
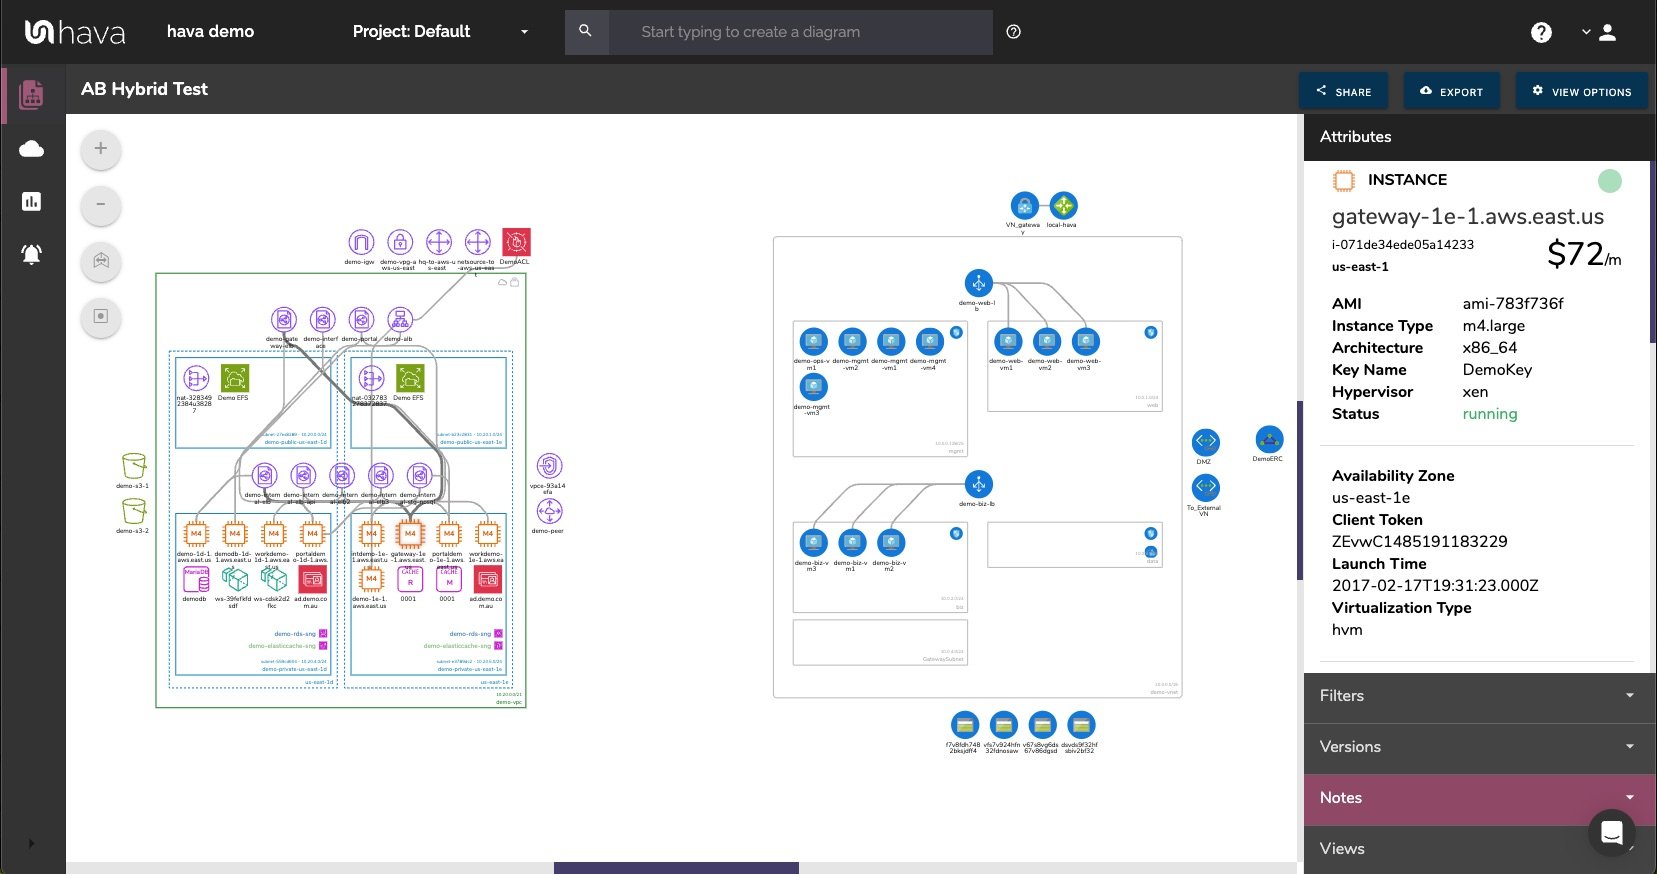
The first diagram generated is the infrastructure view:
The diagram is logically laid out by VPC, with columns representing availability zones which in turn contain the subnets detected.
Individual resources can be selected and the side panel will display all the known attributes of the selected resource.
In the above example, an RDS instance is selected and the attribute pane displays details about the configuration of the database.
The second diagram is the AWS Security Group Diagram. This view shows all your security groups with the open ports and traffic ingress/egress details.
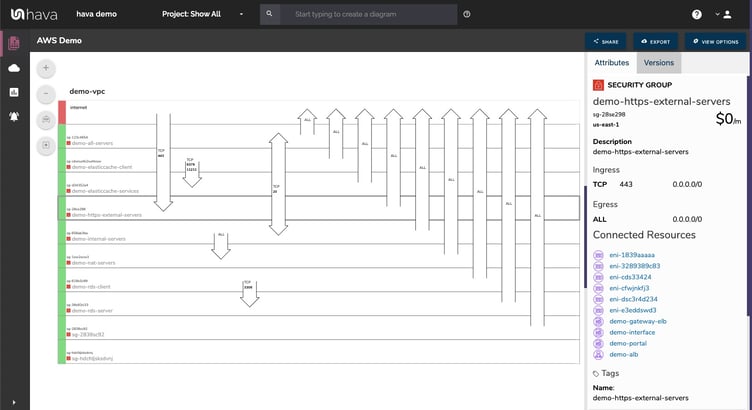
The security groups and ports are also interactive and can be selected to reveal associated metadata.
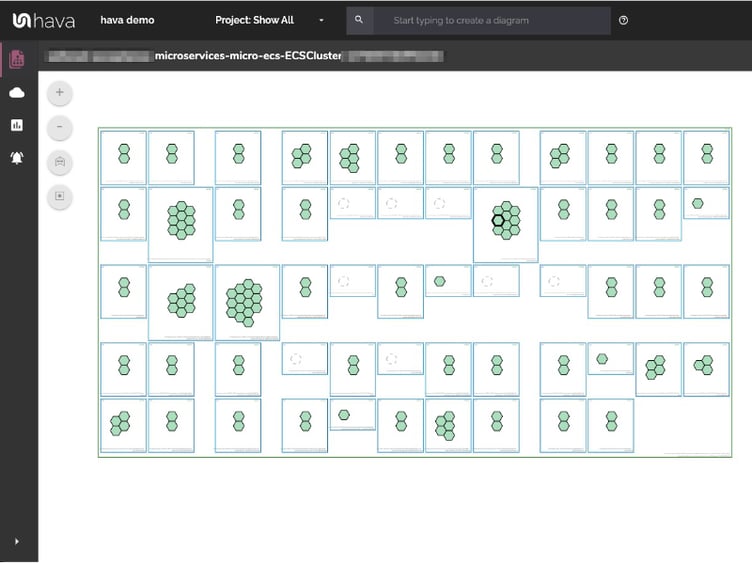
Container workloads are also supported by hava. When detected, a container diagram is produced.
Hava diagrams can be embedded anywhere that will support iFrame code and the fully documented API allows you to trigger actions and events from your IaC pipelines (like diagram artifacts).
A seasoned professional can cast an eye over a network topology diagram and immediate spot redundancy issues. What if the Us-East-1d availability zone has an outage? Will the network hold up, will all the critical databases be available, do the ELBs distribute traffic to all the configured AZ's
With a well laid out infrastructure diagram, it's super simple. With Hava you can also add GCP and Azure into the mix. We work with all three major cloud platforms.
You can of course choose to do this diagramming work manually. It's possible, but in our opinion this is a sub optimal.
Because setting aside the fact that a large cloud network could take days or weeks to diagram, you are leaving yourself open to almost inevitable human error. Adding resources that aren't there any more or completely missing resources you weren't aware of are both common errors.
We once had a client connect their AWS account to hava.io for the first time. It revealed an old test database instance that was costing close to $30k per year that nobody knew about. Just one RDS instance with a big chunk of test data. Nothing else in the subnet. Untouched for years. $2.5k per month.... ouch.
Keeping your diagrams up to date is generally where the best of intentions go astray. Especially in the fast moving, dynamic public cloud space, things change rapidly and keeping diagrams up to date manually is very often overlooked. Partly down to workload pressures and most certainly influenced by priorities. Keeping cloud documentation up to date is the last thing on everyones list of priorities.
Until something goes wrong!
Then having an accurate set of documentation is critical. What changed. What's missing that was there yesterday. Who knows?
With Hava - you do!
Once you connect your cloud accounts to Hava, the application polls your config data continuously and records the changes. Once a change is detected, the old diagrams are archived in version history and a new set of diagrams is produced automatically. All hands free.
You now have a complete audit trail of all config changes, plus you have a fresh new set of diagrams to show your team, management or auditors whenever they ask.
Talking of Auditors, if you are subjected to a PCI compliance audit or tricky questions from a legal or insurance perspective, you always have the documentation to show what your network looked like at any point in historye. Documentation that's 100% accurate that will stand up to scrutiny because there's no way to modify the diagrams. They always represent the truth.
Hava continuously scans your AWS architecture and when changes are detected a new diagram set is automatically generated. The superseded diagrams are not discarded or overwritten. Instead they are moved into version history. Still fully interactive.
What this means is you can view your cloud architecture at any point in time and also leverage Hava's revision comparison (Diff Diagrams) to quickly identify what has been added or removed between the two diagram dates.

So you can easily identify all the changes made since your last compliance audit, or see what changed yesterday that is causing unexpected network or application errors.
While diff diagrams are super helpful in diagnosing changes after the fact, you may want to keep on top of changes as they happen.
Hava's architecture monitoring alerts will let you know the minute a change is detected. You simply nominate the environment you wish to monitor and add a group of recipients to receive the alerts. When a change is detected like the addition or removal of a resource, Hava will send each recipient a diff diagram showing the changes.

Now you and your security team can be across every change as it happens so you can assess and take action if required.
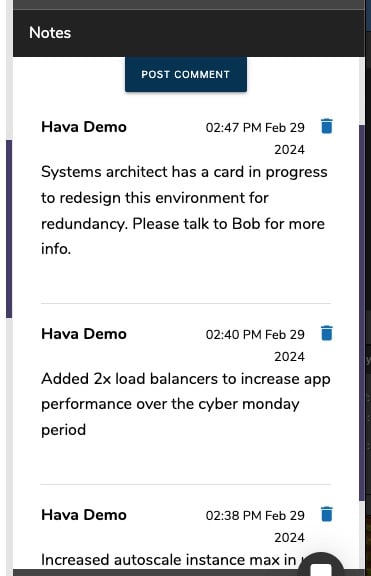
For every architecture diagram generated you have the ability to add text comments. This serves as a rolling dialogue your team can contribute to that may better explain elements of the diagram or bigger picture concepts related to the diagram.
Notes are accessed from the accordion menu within the attribute pane.
New notes are added to the top of the list so they are stored in chronological order.

Learn more about Hava here:

Hava's AWS Architecture Diagram tool automatically generates your AWS Infrastructure Diagrams, hands-free, no drag-and-drop required. Diagrams stay...
Hava's AWS Network Diagram Generator automatically generates your AWS Infrastructure Diagrams, hands-free, no drag-and-drop required. Diagrams stay...
Hava's AWS Architecture Diagramming tool automatically generates your AWS Infrastructure Diagrams, hands-free, no drag-and-drop required.