One of the diagrams that is automatically generated when you connect your AWS account to Hava is the AWS Container View.
If you have container workloads running on AWS, you will get a diagram created like this :
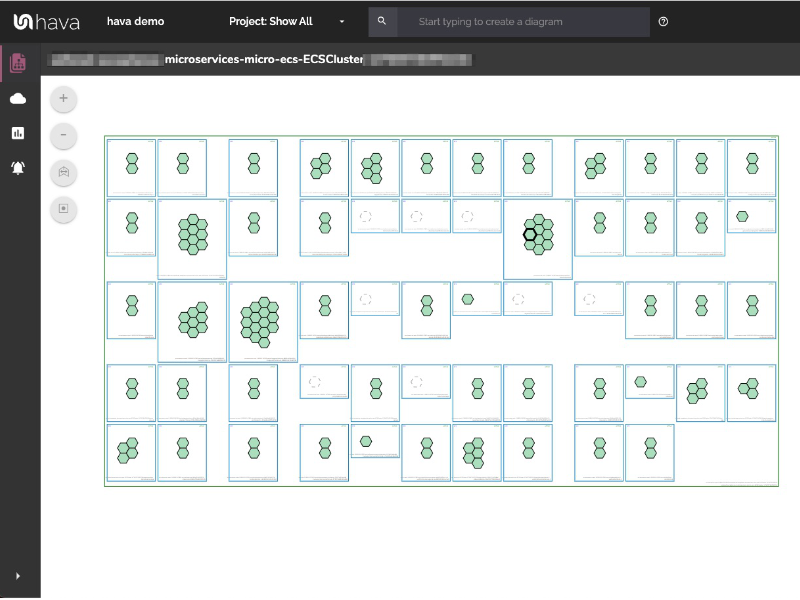
The container diagram is created for your entire ECS cluster. You can see all the services and tasks currently running, any load balancing available to your containers as well as unused or pending capacity.
Container Service and Capacity Information
The AWS Container Diagram View will generally show one main cluster around one or more service containers, showing the individual services that make up the cluster as well as the tasks running inside.
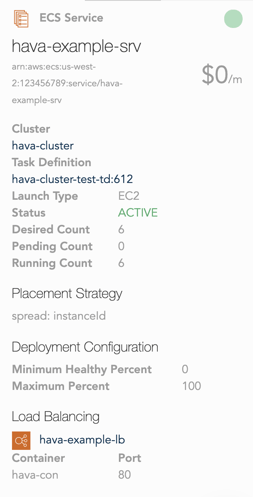
At the top of the container you can see information about the state of the container as well as it's location, while at the bottom you can see the name and the ID of the service. Clicking anywhere in the service will display all the services attributes in the right hand attributes panel.
Towards the top of the service you will see load balancing information if there are any load balancers connected to your containers. This will show the port and the container the load balancer is connected to for each task. Click the load balancer box to see more information about the target group or class load balancer that is attached.
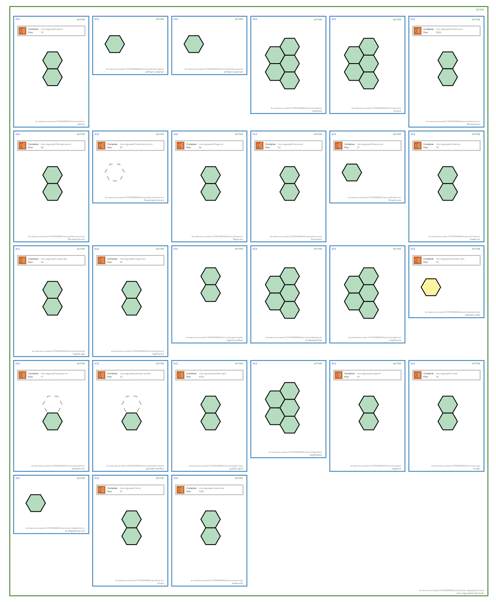
Each of the tasks running within the service are shown as a hexagonal icon that can be clicked to see the information for the specific task. Tasks are displayed in different styles depending on their current state:
Green tasks are running successfully.
Yellow tasks are in a pending state, usually starting up or shutting down. You can click the task for more details.
Dashed tasks are spare capacity in the service, where the desired count is less than the running count.
Detailed Resource Information
Clicking on any resource on the container diagram will display detailed information about that resources in the attributes bar on the right hand side. This can be used to get more detail on what the diagram is displayed.
From the main cluster you can see what services and tasks are running, as well as the container instances the cluster is spread across. If you are running in an EC2 cluster you will also be able to see the underlying EC2 instances.
From the service you are able to see the task definition it's using as well as deployment and placement information. You can also see a list view of all the tasks running within the services currently, and any load balancing available to those tasks.
In the task attributes you can see the containers running within the task, the container instance it's deployed onto, and the current status of the task.
Hava automatically generates diagrams, keeps them up to date and places superseded diagrams in a version history for analysis or audit purposes. There is also a fully featured API, CLI, CI/CD integrations and the ability to self-host Hava on your own infrastructure.
If you would like to start visualising your cloud infrastructure automatically for either AWS, Microsoft Azure or Google Cloud Platform we invite you to take Hava for a free trial, learn more using the button below.