There was
Hava was born
We knew the cloud-config data was accessible from the cloud providers. We also knew we had some pretty incredible coding talent leading our teams, so we decided to see if we could automate the process and build diagrams directly from the configuration data.
The significant investment in time and money required to build hava was daunting, but our management had the vision (and still does) and they could see the returns to our consulting division would pay off over and over as days and weeks of work were reduced to just minutes.
What did we solve
- Always up to date diagrams. Hava continuously polls config data automatically or on-demand.
- Removed human error. Hava maps actual network topology so you see your environments from the source of truth.
- Logically laid out clean diagrams you can use to easily explain what's going on.
- Ability to instantly respond to management and auditors.
- A full audit trail of config changes. Any changes across your entire cloud account is captured in the version history.
- In-depth attributes list. Click on a resource and drill into all the properties and associations.
- Visualized AWS infrastructure by VPC with Peering.
- Visualized Azure infrastructure by Virtual Network and Subnet.
- Visualized GCP infrastructure by Network and Subnet.
- Visualized the AWS security groups showing open ports and traffic flow.
- Built custom search capability to allow you to create your own hybrid cloud diagrams.
- Filter function to limit a custom diagram to your required region, VPC, subnet, virtual network, source or IP ( or any combination thereof )
The list goes on and on. Hava provides so much more data and detail, it's hard to justify calling it a diagramming tool - it's so much more.

What can you do?
Once you connect Hava to your data sources (cloud accounts) we import the configuration data and render the infrastructure diagrams.
There are separate diagrams for different use cases. .
- The Infrastructure View diagram as seen above lays out your environment and details the resources that make sense to visualize.
- The List View is a comprehensive list of all the resources found in your config including minor components that would clutter up the diagram, like network cards & WAF rules
- The AWS Security view shows everything your security team needs to know.
You can export these diagrams at any time into your favorite drawing tool or to a JPG or PDF for inclusion in management reports.
The diagrams are updated every time a change is detected and the old version is stored in the archived config area. This means you can go back in time and pull documentation showing the state of play at any point in history, which is worth its weight in gold when something breaks or you get a PCI compliance, security or insurance audit.
REPORTING MODULE
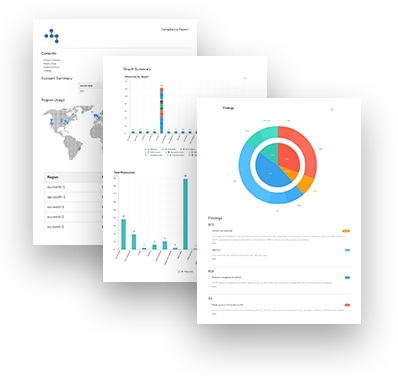
Alongside your interactive diagrams, Hava also has a reporting module that automatically builds reports related to your cloud environment.
The AWS compliance report, for instance, compares your environment configuration against AWS well-architected / best practice and reports resources and any adverse findings in a stylish management report format.
EMBED DIAGRAMS ANYWHERE

With Hava's built-in embeddable diagram viewer, you can place diagrams externally via an iFrame code snippet. No login is required to view the live, fully interactive diagrams.
API
Hava has a fully-featured API that enables you to pull config data, fire sync requests, and perform any number of tasks and functions.
The API be used to extend Hava's functionality, customers have documented tasks like adding animated gifs of a network topology diagram into a build pipeline CI output.
What's in it for you?
Some of the major reasons our Engineer/DevOps clients love hava.io include:
- Saves hours or days on initial network mapping and diagram production
- Makes it easy to spot anomolies like old test environments potentially costing your business or clients money
- Speeds up the onboarding of new engineers
- Automates updating diagrams from day one
- Makes reviewing security so much easier using the security view diagram
- Responding to requests for documentation takes minutes instead of hours because you've got better things to do
- Cuts costs, especially if you are paying expensive contractors to document your environments
Hava is available in two formats. You can simply connect your cloud credentials to the cloud SaaS version at hava.io and you'll be producing elegant 100% accurate diagrams in minutes.

If you need a self-hosted Enterprise solution, then have a chat with our sales/support staff and we can organize a discovery call to explore how we can best serve your organizational needs.

Do you have some questions?
There's a chat dialogue at the bottom right of this page, or you can email us at sales@hava.io and we'll get back to you promptly.
Thanks for your interest in Hava automated cloud diagrams.