aws
Amazon AWS Kubernetes Diagrams
Auto generate and auto update AWS Kubernetes Diagrams with Hava. View your EKS clusters in interactive diagram form to see what tasks are running and...
With the wide adoption of containers as a method of rapidly deploying software applications to the cloud, the need to visualise workloads has been gaining momentum. The need to see the status of pods and tasks in container clusters is a major benefit when you visualise containerised workloads on an interactive diagram.
Hava has always generated diagrams for traditional compute VPCs and virtual networks and for a long time has also automatically generated AWS ECS Cluster diagrams when clusters are detected in a connected AWS account.
The ability to diagram other containerised workloads, particularly the market leading Kubernetes has now been added to the core functionality of Hava so you can now view AWS EKS Kubernetes clusters, Azure Kubernetes Clusters (AKS), Google Kubernetes Clusters (GKE) and also stand alone Kubernetes Clusters
One of the diagrams that is automatically generated when you connect your AWS account to Hava is the AWS ECS Container View.
If you have container workloads running on AWS ECS, you will get a diagram created like this :
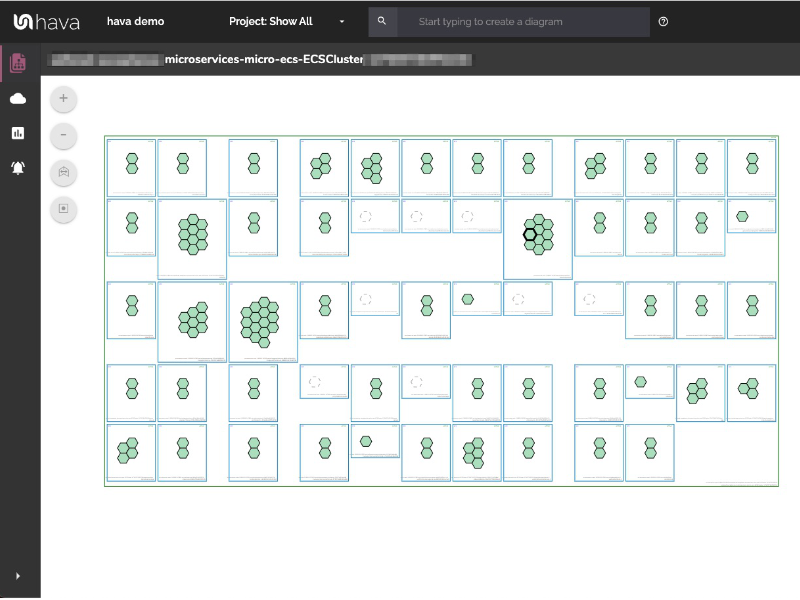
The container diagram is created for your entire ECS cluster. You can see all the services and tasks currently running, any load balancing available to your containers as well as unused or pending capacity.
The AWS Container Diagram View will generally show one main cluster around one or more service containers, showing the individual services that make up the cluster as well as the tasks running inside.
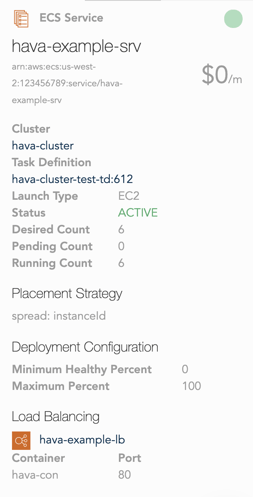
At the top of the container you can see information about the state of the container as well as it's location, while at the bottom you can see the name and the ID of the service. Clicking anywhere in the service will display all the services attributes in the right hand attributes panel.
Towards the top of the service you will see load balancing information if there are any load balancers connected to your containers. This will show the port and the container the load balancer is connected to for each task. Click the load balancer box to see more information about the target group or class load balancer that is attached.
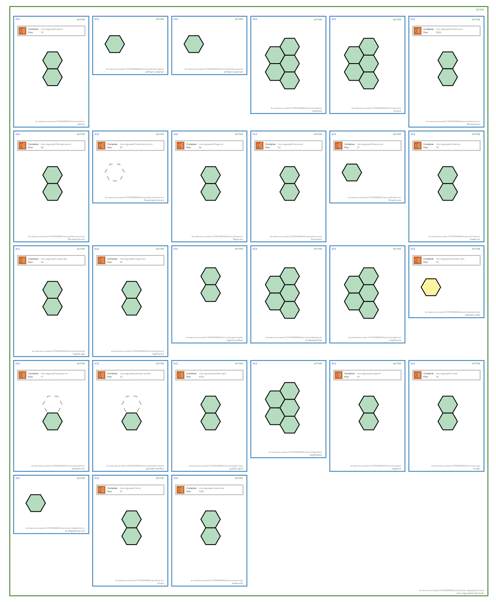
Each of the tasks running within the service are shown as a hexagonal icon that can be clicked to see the information for the specific task. Tasks are displayed in different styles depending on their current state:
Green tasks are running successfully.
Yellow tasks are in a pending state, usually starting up or shutting down. You can click the task for more details.
Dashed tasks are spare capacity in the service, where the desired count is less than the running count.
Clicking on any resource on the container diagram will display detailed information about that resources in the attributes bar on the right hand side. This can be used to get more detail on what the diagram is displayed.
From the main cluster you can see what services and tasks are running, as well as the container instances the cluster is spread across. If you are running in an EC2 cluster you will also be able to see the underlying EC2 instances.
From the service you are able to see the task definition it's using as well as deployment and placement information. You can also see a list view of all the tasks running within the services currently, and any load balancing available to those tasks.
In the task attributes you can see the containers running within the task, the container instance it's deployed onto, and the current status of the task.
AWS managed EKS clusters that you set up in your AWS account will appear as a sub-source on your AWS account data source connected to Hava. Once connected by adding the Hava role to your EKS clusters, cluster container diagrams will be automatically generated for the connected EKS clusters.
With this new support, all you need to do is add the role you use to connect to Hava to your EKS cluster aws-auth ConfigMap within the cluster and Hava will start automatically diagramming your EKS cluster automatically.
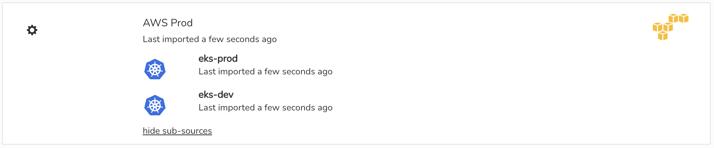
Once connected, the AWS datasource (account) that is connected to Hava will show EKS clusters as a sub-source of the account.
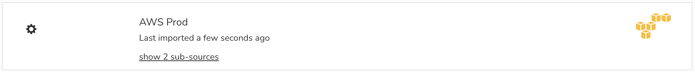
Detected EKS Clusters are referred to as sub-sources. You can view the detected EKS clusters by clicking on the show sub-sources link on your AWS accounts connected to Hava.
Unfortunately AWS IAM does not support giving a role or user access to the EKS clusters from the parent account, so a config change has to be added to each cluster. To allow Hava access to your EKS clusters you need to make sure that the user or role you use to import in Hava is added to the mapUsers section in your aws-auth ConfigMap within the cluster.
You can see how to connect your AWS EKS Clusters to Hava by following the latest instructions in the Kubernetes section of the Hava documentation here:

In the latest release, Hava users running GKE workloads will see container diagrams auto generated in their environments dashboard. This new functionality closely follows the addition of direct import of stand alone Kubernetes clusters.
Soon, you will not have to do anything to invoke the import and diagramming of your GKE diagrams. If a GCP account you have already connected to Hava contains GKE workloads, the diagrams will appear automatically. While the feature is in limited release, please get in touch to get it switched on for your account.
Since the GKE workloads belong to a connected datasource, there is no way to delete or remove the GKE container view diagrams as they are treated as a sub-source or child entity of the main GCP account you have connected.
If you have GCP accounts that are exclusively running GKE workloads, you can now connect them to Hava to automatically visualise your GKE workloads. This will allow you to view the status of your clusters, nodes and pods to help visually identify potential problems.
As with all auto generated interactive Hava diagrams, when changes are detected a new diagram is created and the replaced diagram is moved to version history so you can still access it for comparison and audit purposes.
An obvious addition to the functionality of Hava to meet the needs of customers running stand alone K8s clusters was adding stand alone Kubernetes clusters to the supported data sources used by Hava to visualise cloud infrastructure. Up until recently, you needed to connect either an AWS, Azure or GCP account (data source) which Hava would scan and automatically generate network topology, security and container diagrams.
The Kube import feature is now available as a private Beta. Please get in touch if you would like access.
Hava has supported AWS ECS cluster diagrams known as container views for some time, but with this release introduces stand alone K8s cluster support.
With this new addition, you can connect any Kubernetes cluster to Hava using a generated configuration file. Hava will then scan the cluster and visualise the cluster and running pods giving you a visualisation of your containerised workloads.
One of the major benefits of visualising your containers, services and tasks or pods is you can see at a glance the operational status of your workloads. Hava uses hexagonal icons to represent tasks and color codes them depending on their operational status. This means at a glance you can see any tasks that are not running properly.
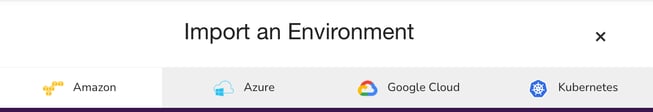
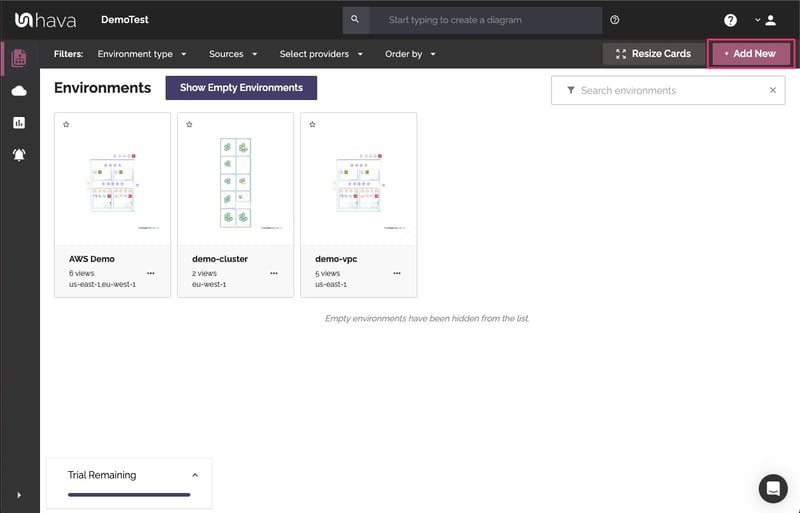
Connecting your Kubernetes cluster to Hava starts at the same place you would import a new AWS, GCP or Azure environment, the add environment tile in Hava's environment dashboard.
On the import an environment screen, select the Kubernetes tab.
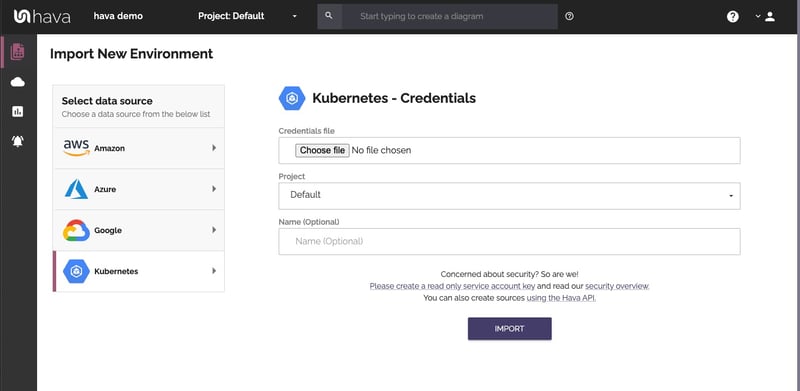
To connect to your K8s cluster you will need to import a file containing your kubeconfig. We recommend creating a new read-only service account for Hava to access your cluster.
Details on how to create the roles and kubeconfig access file see our documentation here: Read Only Kubeconfig.
Once you have your hava-kubeconfig.yml file enter it into the import dialogue and import your cluster.
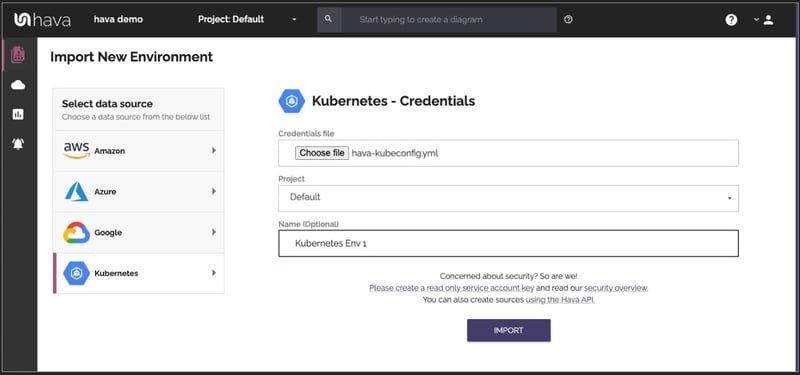
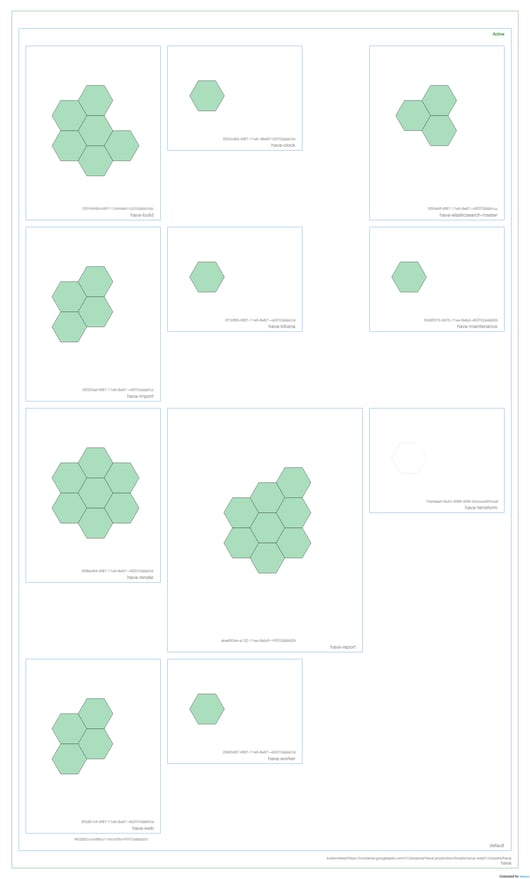
Hava will then scan your cluster and auto generate a complete visualisation of the resources detected, cluster, nodes, pods and the relationships between them.
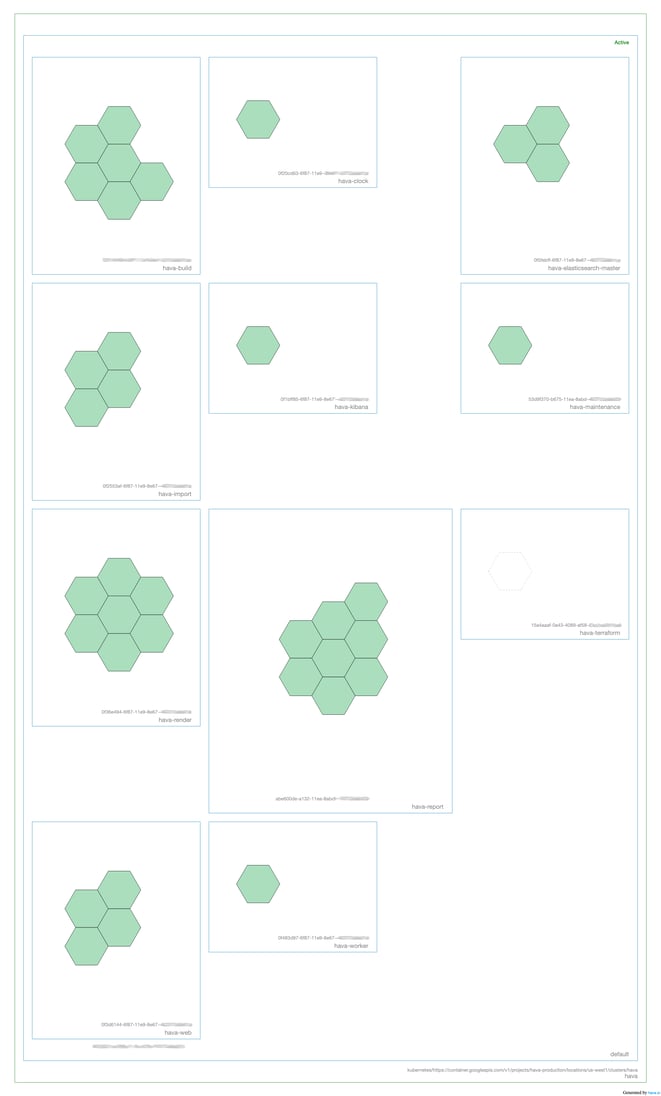
In the above example all the pods are green indicating a healthy state. As with all Hava interactive diagrams you can select a pod to see all the containers running in it, you could hover over a node in the attributes pane to highlight all the pods running on that node. The power of the visualisation is when things aren't running as expected.
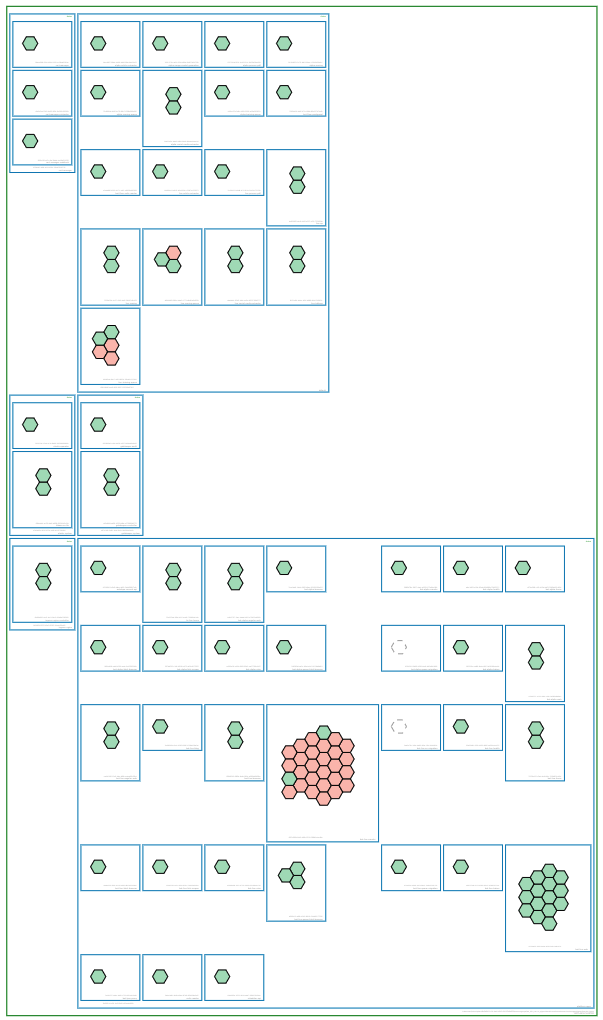
The colour of each pod indicates the run status of the workload. The green indicates healthy and running, but the red indicates a sub-optimal health status like stopped. An amber pod denotes the status is changing, so it could be starting or stopping.
By selecting a suspect pod, you are able to see the meta data in the attribute pane including the connected containers and associated nodes in the cluster so you can quickly identify what needs to be addressed in order to return the workloads to optimal health.
To round out the comprehensive coverage of Kubernetes cluster diagrams, Hava have also added auto generation of public Azure AKS clusters. You'll need to add a role to the service principal you used to import your Azure infrastructure data into Hava.
You can use Powershell to run:
$sp = Get-AzADServicePrincipal -DisplayName <hava-service-principal-name>
New-AzRoleAssignment -ObjectId $sp.Id -RoleDefinitionName "Azure Kubernetes Service Cluster User Role"
Then simply resync your Azure datasource in Hava and container diagrams will be generated of your public AKS clusters.
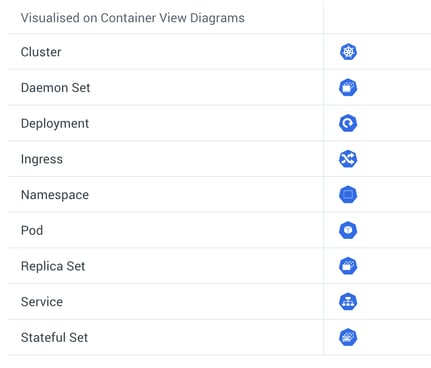
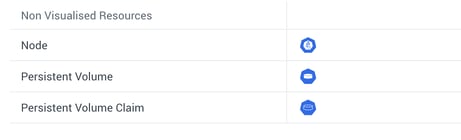
Just like the VPC infrastructure diagrams, the container diagrams are made up of visualised resources and non-visualised resources that only appear in the attribute panel and on the Hava List View
No matter what cloud platform you are developing on or supporting, be it AWS, GCP Azure or stand alone Kubernetes, Hava automatically generates diagrams, keeps them up to date and places superseded diagrams in a version history for analysis or audit purposes. There is also a fully featured API and the ability to self-host Hava on your own infrastructure.
If you would like to start visualising your cloud infrastructure automatically for either AWS, Microsoft Azure or Google Cloud Platform we invite you to take Hava for a free trial. Learn more using the button below.
Auto generate and auto update AWS Kubernetes Diagrams with Hava. View your EKS clusters in interactive diagram form to see what tasks are running and...
Diagrams showing the status of your cloud containers, pods and tasks can be invaluable when diagnosing the health of your containerised workloads.
AWS offers a number of services to run containerized applications on top of AWS infrastructure. In this post we take a look at the various container...