aws
Cloudcraft Alternative Hava.io
If you are looking for a viable Cloudcraft alternative, drag and drop free, that generates AWS, GCP, Azure and hybrid diagrams, with security...
Probably one of the most requested features from our clients building on Azure is for a security group view like the one that has been available for AWS for a while.
Now generally available, we're pleased to announce that the Azure Security View is now live.
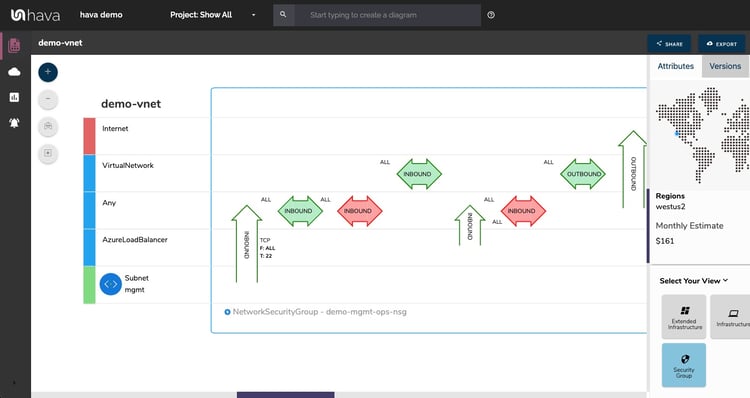
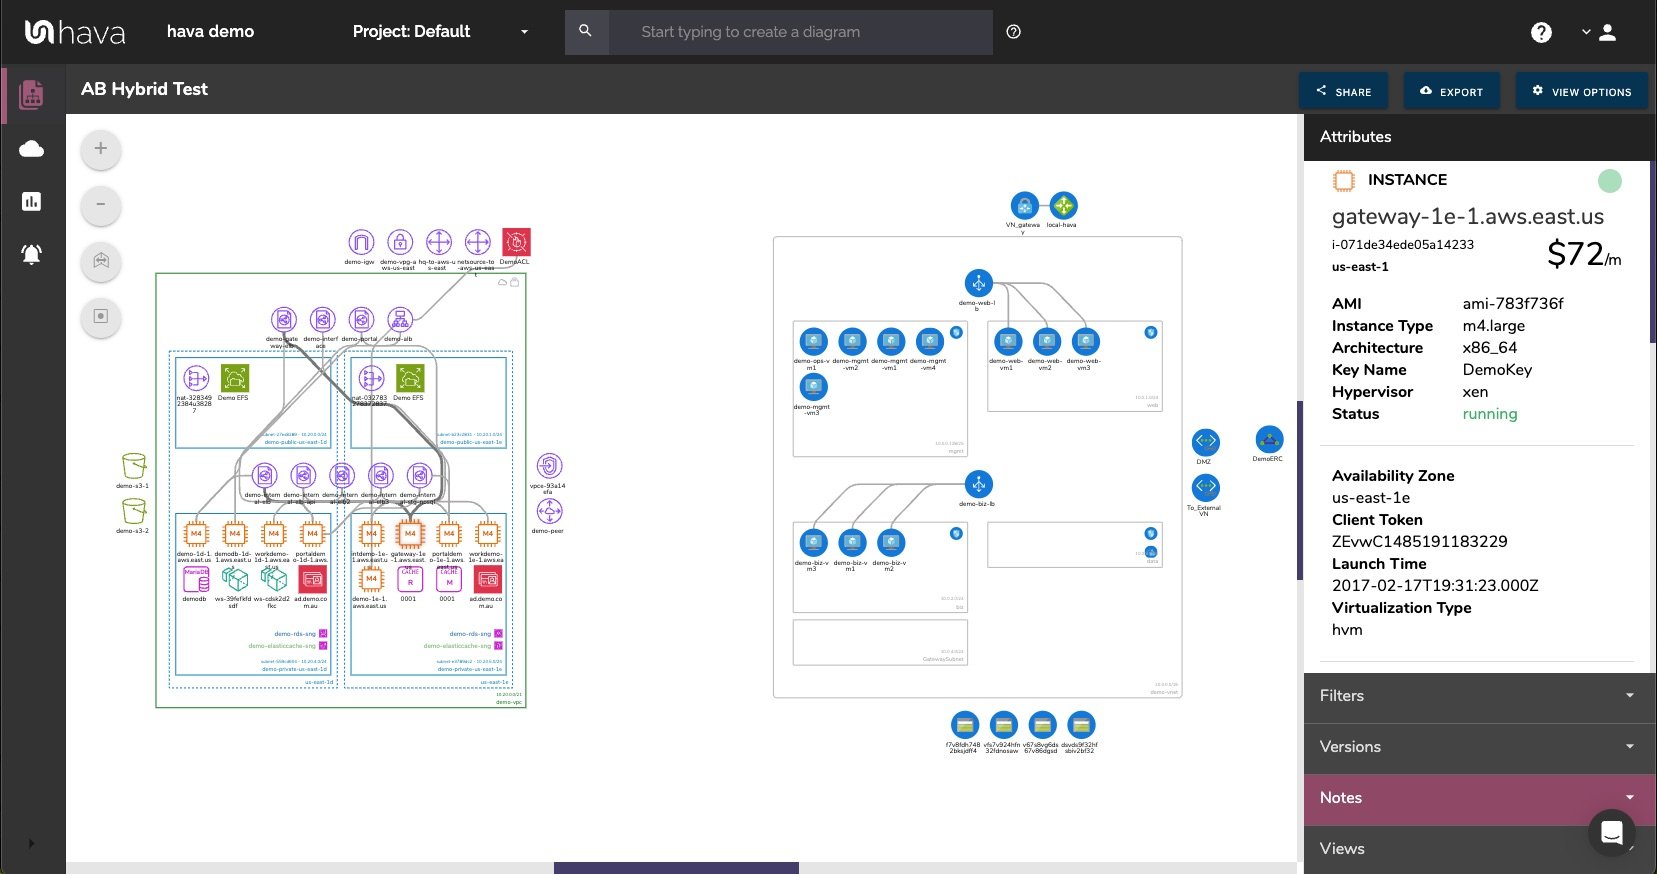
Each Azure security group is represented by the large blue rectangle and the connected destinations shown horizontally. Traffic and rules are represented with arrows with the green and red horizontal arrows displaying inbound and outbound rules, ports, protocols and source/destination and the vertical arrows showing traffic between different sources and destinations.
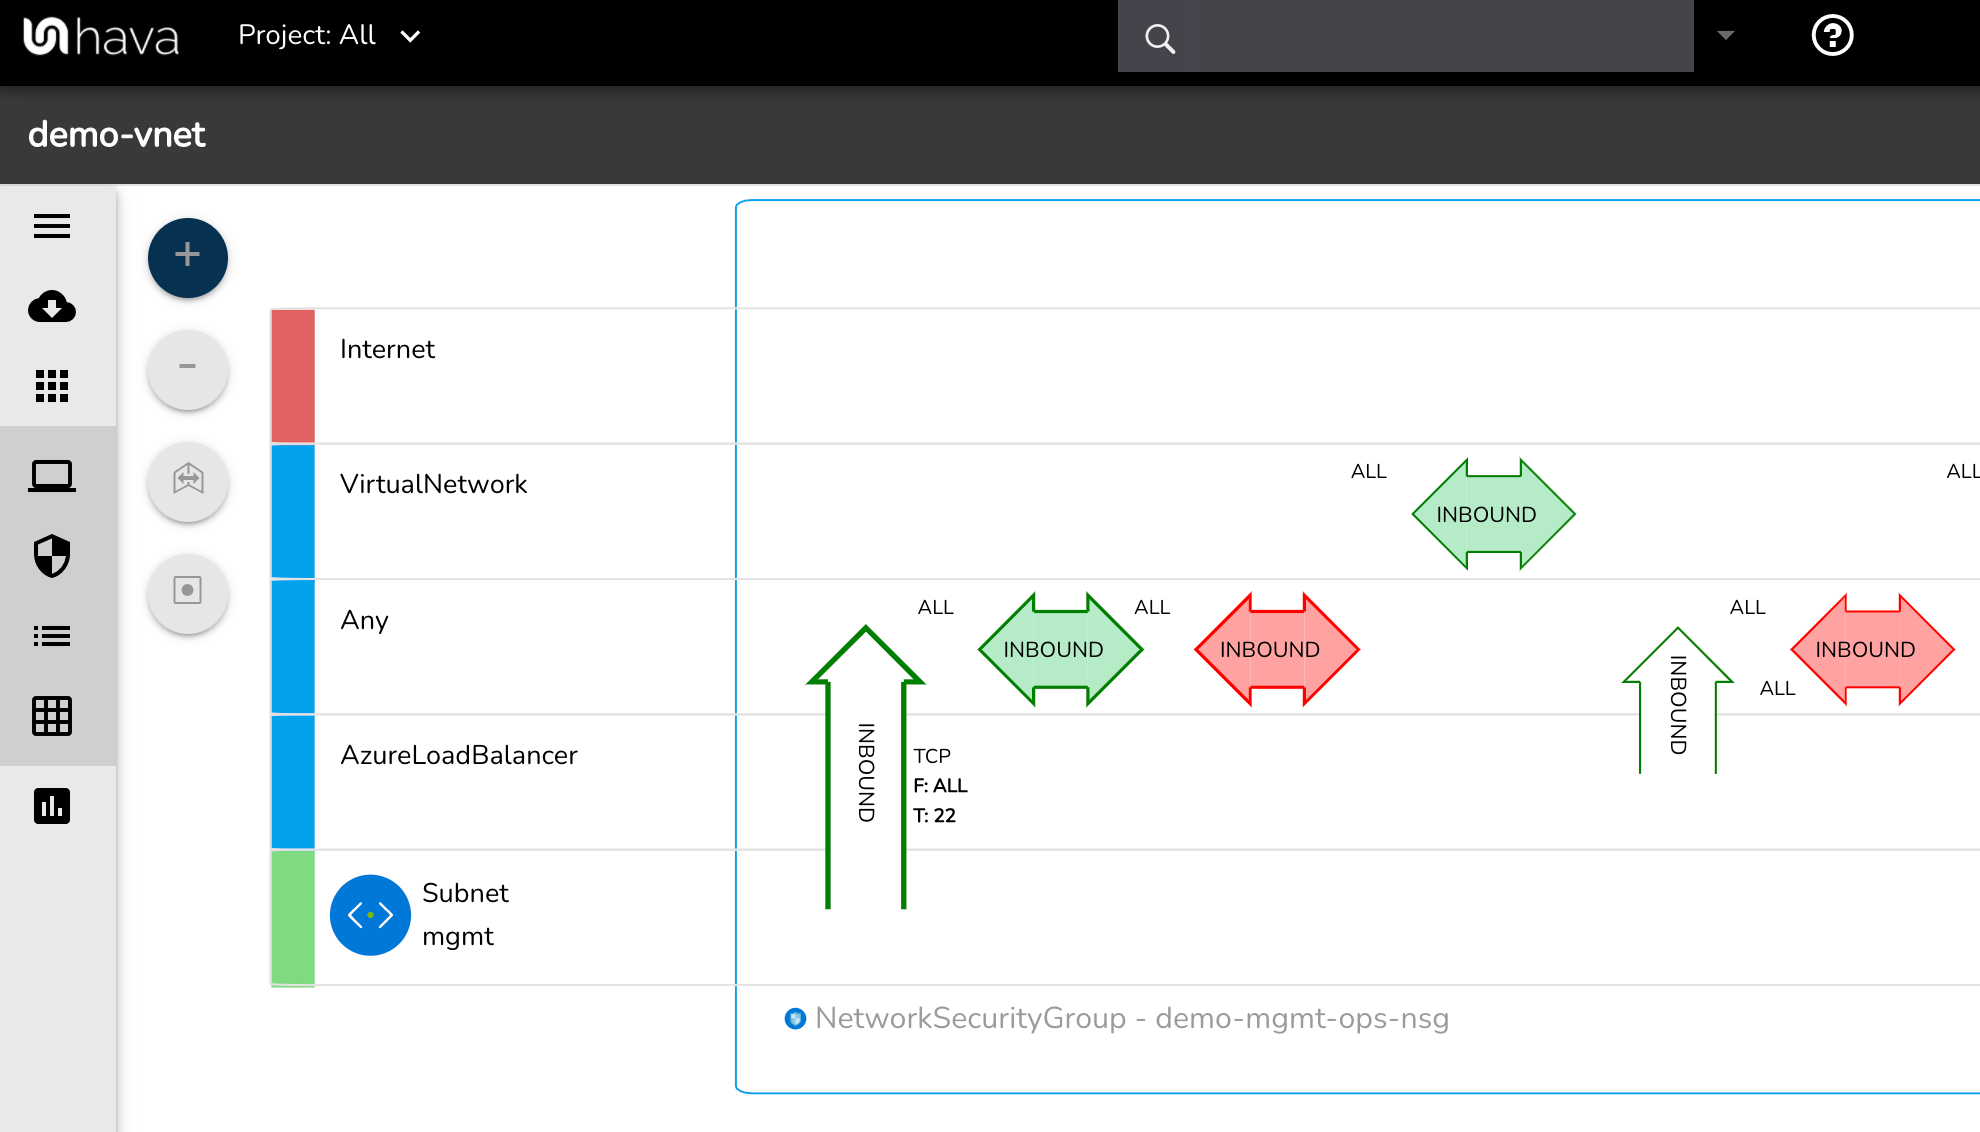
With a Network Security Group selected on the diagram the attribute pane to the side of the diagram will show :
If you are not familiar with Hava, it is an application that allows you to connect a cloud data source, like an Azure, GCP or AWS account and once connected Hava will scan your cloud config, discover VPCs, virtual networks or container workloads and build a diagram set detailing the resources and security groups discovered.
When you leverage the power and accuracy of Hava to create your Azure infrastructure diagrams on autopilot you only need to connect your Microsoft Azure account once. That's it.
Hava can be hosted on your own infrastructure (self-hosted) or you can simply subscribe to a SaaS plan and be up and running in a minute or two.
Then all you need to do is create a new service principal and plug that into Hava. The Service Principal connection provides secure read-only access to portal metadata which is what Hava uses to analyse running resources and construct diagrams.
So a minute or two of effort on your end, to create potentially unlimited resource group diagrams that stay up to date automatically until you disconnect.
So what do you get when you connect Hava to your Azure account, or indeed multiple Azure accounts.
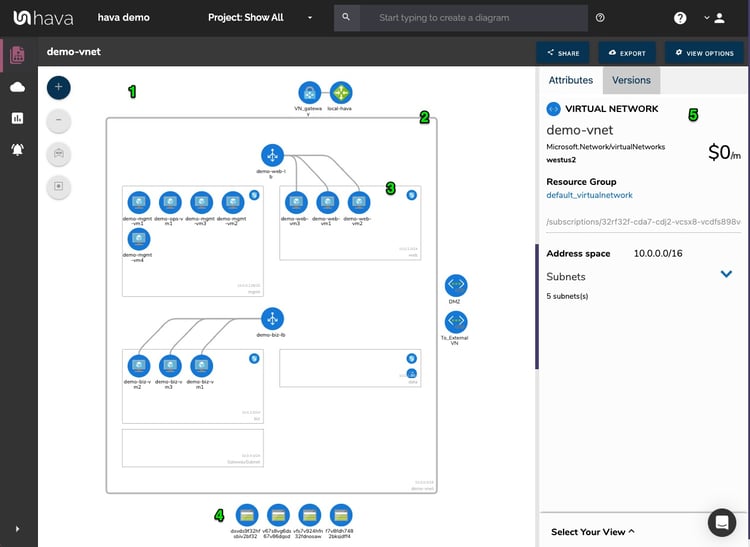
The first diagram you get is the Infrastructure View.
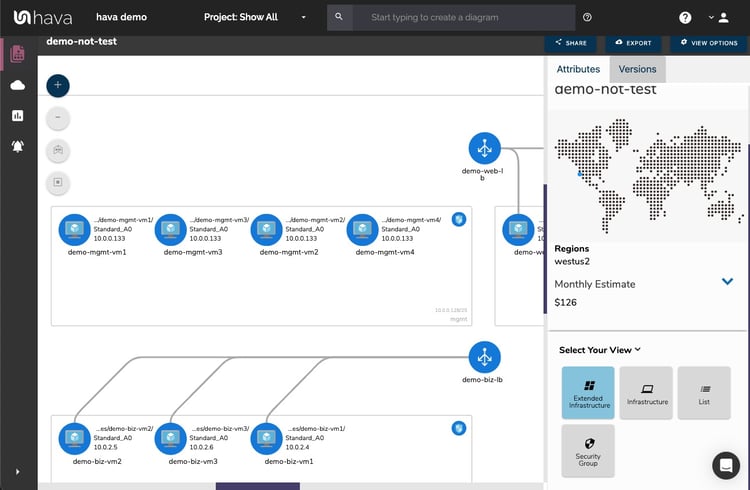
The Azure Infrastructure view lays out your Azure resource groups into separate diagram sets. Subnets within the Virtual Network are mapped and details resources both inside and outside the subnets and virtual networks on the diagram .
All the diagrams automatically generated by Hava are interactive. Which means, clicking on any of the resources on the diagram changes the attribute panel on the right of the diagram which allows you to take a deep dive into the resource settings like security groups, IP ingress/egress ports, connected storage and so on. The infrastructure view diagrams also display the estimated costs of each resource which are totalled for the entire environment when the environment is opened up.
Diagrams created by Hava are kept as clean and readable as possible. By default, connections and resource names are not shown, however these can be toggled on like in the example below.
Right from the beginning, our engineers decided to keep the Hava diagrams clean and free from non essential resources like network interfaces that could flood the diagrams with lots of unimportant information making them messy and confusing.
Although these less important components are not on the infrastructure diagrams, we did need to know about these 'non-visualized' components, so we created the Hava "List View". The List View is an extensive data set that lists all the resources discovered in your Azure configuration. This view lists both visualized and non-vizualized resources.
The listed resources also have an estimated cost detailed against them.
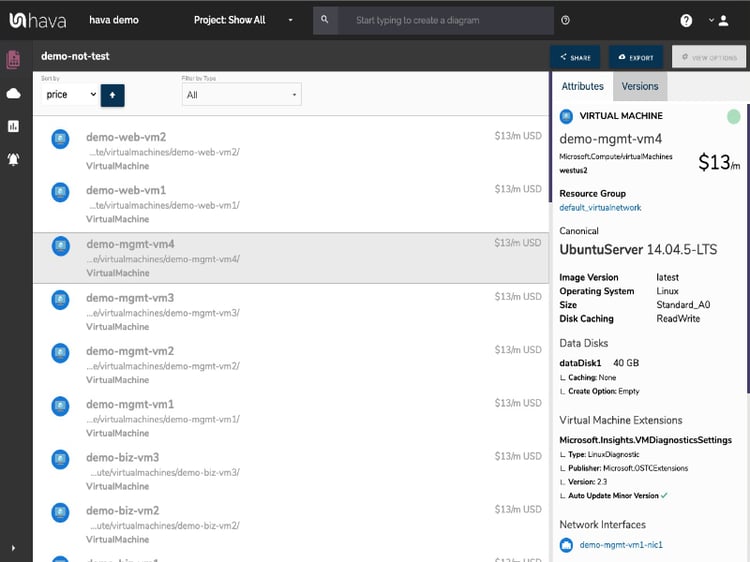
One of the benefits of this list view is the ability to sort the list by costs. This surfaces what resources make up the bulk of your estimated Azure cloud spend which should help when you are looking to save cloud costs or explain to management which important resources make up the bulk of your Azure bill.
Hava continuously scans your AWS architecture and when changes are detected a new diagram set is automatically generated. The superseded diagrams are not discarded or overwritten. Instead they are moved into version history. Still fully interactive.
What this means is you can view your cloud architecture at any point in time and also leverage Hava's revision comparison (Diff Diagrams) to quickly identify what has been added or removed between the two diagram dates.

So you can easily identify all the changes made since your last compliance audit, or see what changed yesterday that is causing unexpected network or application errors.
While diff diagrams are super helpful in diagnosing changes after the fact, you may want to keep on top of changes as they happen.
Hava's architecture monitoring alerts will let you know the minute a change is detected. You simply nominate the environment you wish to monitor and add a group of recipients to receive the alerts. When a change is detected like the addition or removal of a resource, Hava will send each recipient a diff diagram showing the changes.

Now you and your security team can be across every change as it happens so you can assess and take action if required.
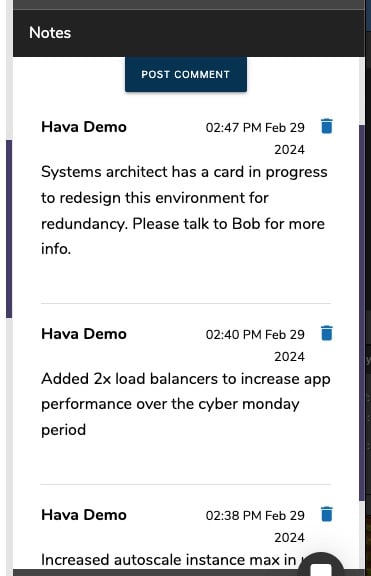
For every architecture diagram generated you have the ability to add text comments. This serves as a rolling dialogue your team can contribute to that may better explain elements of the diagram or bigger picture concepts related to the diagram.
Notes are accessed from the accordion menu within the attribute pane.
New notes are added to the top of the list so they are stored in chronological order.
There are currently two options for using Hava to generate your cloud infrastructure diagrams.
Option 1: SaaS
The SaaS option is by far the quickest and easiest way to start visualizing your Azure cloud infrastructure.
You simply create an Azure service principal with read only permissions, then log into hava.io and connect your Azure account. Hava will read your Azure config data and render the diagrams and start to track any changes for audit purposes.
A 14 day fully functional trial is available (along with demo data) so you can try Hava for yourself. At the time of writing, no credit card is required to take the trial.
Option 2: Self Hosted
The self hosted option allows you to run Hava from within your own infrastructure. If you have particular security or enterprise policies that prevent the connection of 3rd party applications to your cloud environments, then self-hosted may be the solution.
Both options are identical in functionality, but you will need to contact our support team to organise a self-hosted solution.
As well as using the application console to generate and view diagrams, Hava has a fully featured API that allows you to programmatically add and remove data sources, projects and diagrams.

We recommend requesting a one on one demo with our sales team if you would like to see Hava in action and explore the self-hosted option.
You can contact us via sales@hava.io or jump into a free trial here:

If you are looking for a viable Cloudcraft alternative, drag and drop free, that generates AWS, GCP, Azure and hybrid diagrams, with security...
If you are looking for a viable Arcentry alternative, drag and drop free, that generates AWS, GCP, Azure and hybrid diagrams, including security...
The auto generated security group Hava diagrams now include protocol names, rule source and destinations, segmented security display on hybrid and...