cloud
Microsoft Azure Diagram Generator
Microsoft Azure diagrams are a useful tool when building or managing Azure Cloud infrastructure. Here's how to Automate the process.
When you are working with Azure cloud computing infrastructure in your role as a DevOps engineer, there are many benefits to creating and maintaining accurate Microsoft Azure diagrams.
You can effectively communicate your Azure network design to both technical DevOps staff, developers and also management where necessary. If you are onboarding new DevOps engineers, or engaging external consultants, you can bring them up to speed very quickly with a well laid out accurate infrastructure diagram.
If you are taking on a new client, application or project, having access to detailed infrastructure documentation is a massive advantage when trying to understand exactly what is running where. Back in our cloud consulting days, diagramming a new client's infrastructure was always the first job in the on-boarding process. It was often time consuming, laborious but necessary in establishing exactly what was going on prior to starting work on improving or redesigning infrastructure.
If you have spent way too many hours manually updating Azure network diagrams to keep control of your network design as you roll out new versions and features, then you can also appreciate how much time is saved and how many errors are eliminated when you fully automate the network topology diagramming process.
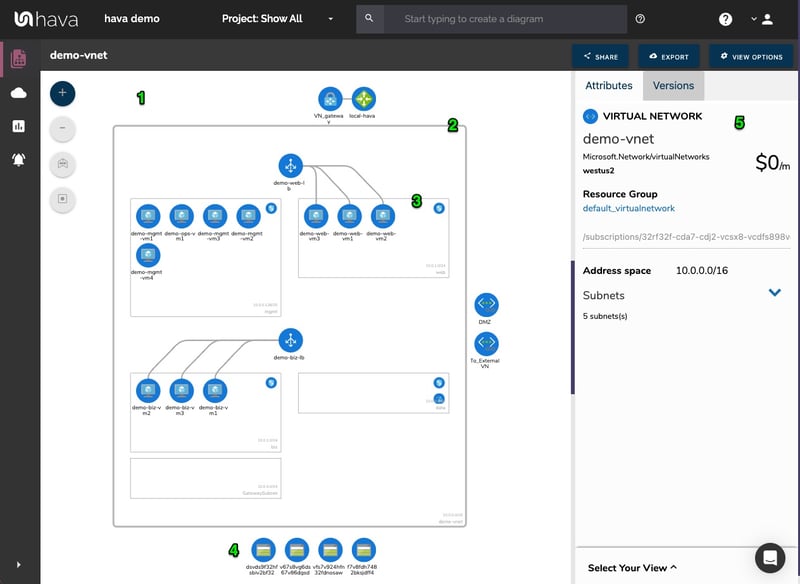
Azure is one of many cloud platforms that are compatible with hava.io which will safely connect to your cloud console configuration via read only credentials to automate the production and updating of azure infrastructure diagrams like this:
Connecting Hava to your Microsoft Azure account so that your network topology diagrams can be automatically generated is a relatively simple process.

To import your environment resources from Microsoft Azure, you will need to access your Azure Portal at https://portal.azure.com
You then create a new Service Principle and retrieve a set of credentials to connect to Hava.
To do this, open the Azure Portal and launch PowerShell from the top menu bar :
1. Launch Powershell
Open the Azure Portal and launch PowerShell from the top menu bar

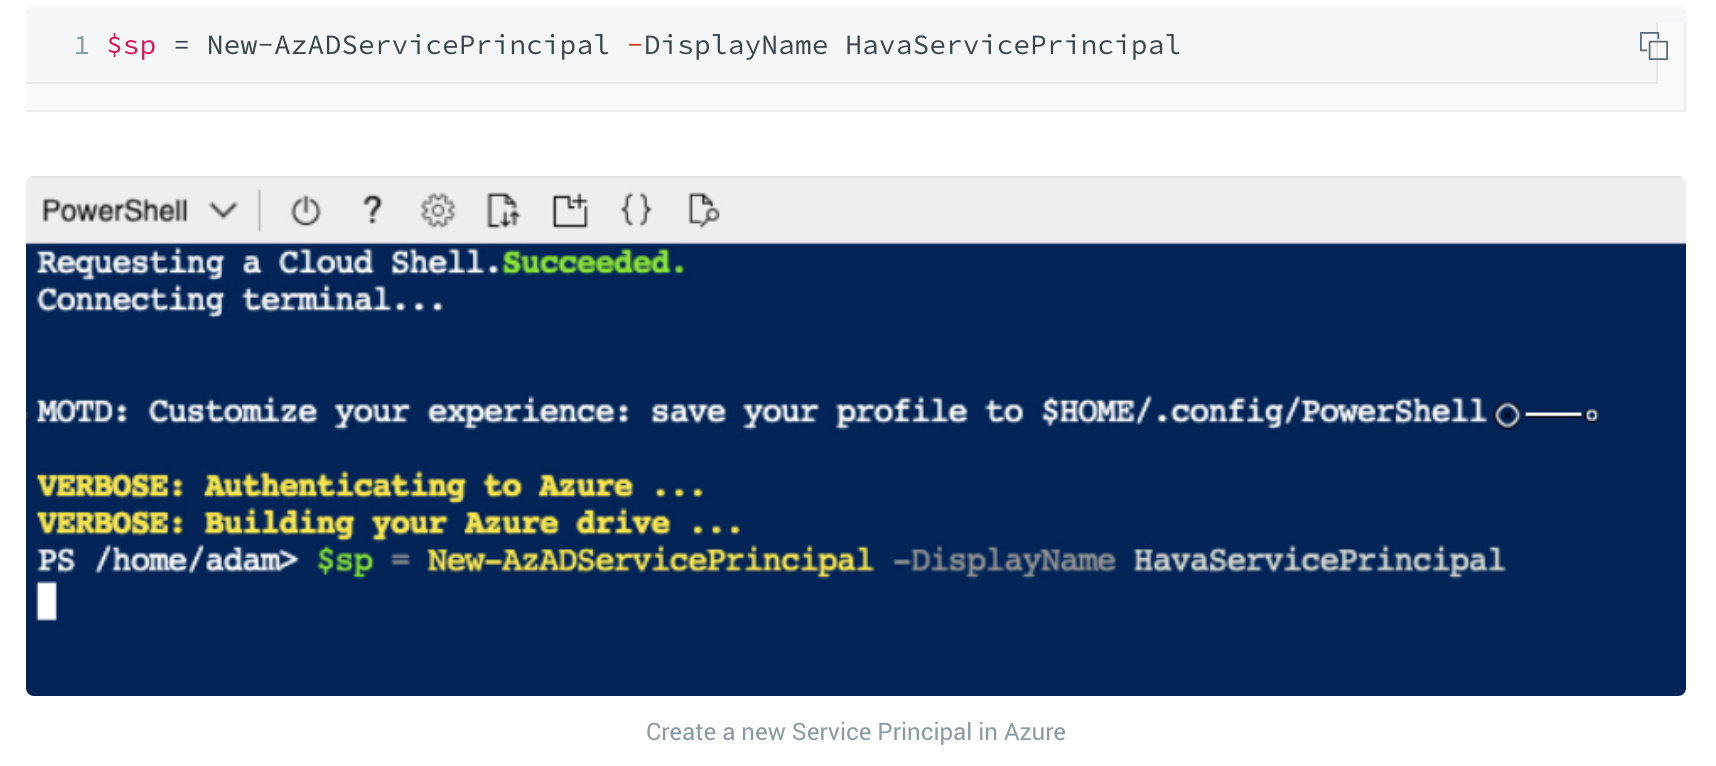
2. Create Service Principal
You will need to create a new Service Principal from the command line and a display name. In the below code example, we’ve used HavaServicePrincipal you can edit and choose a name that suits you.
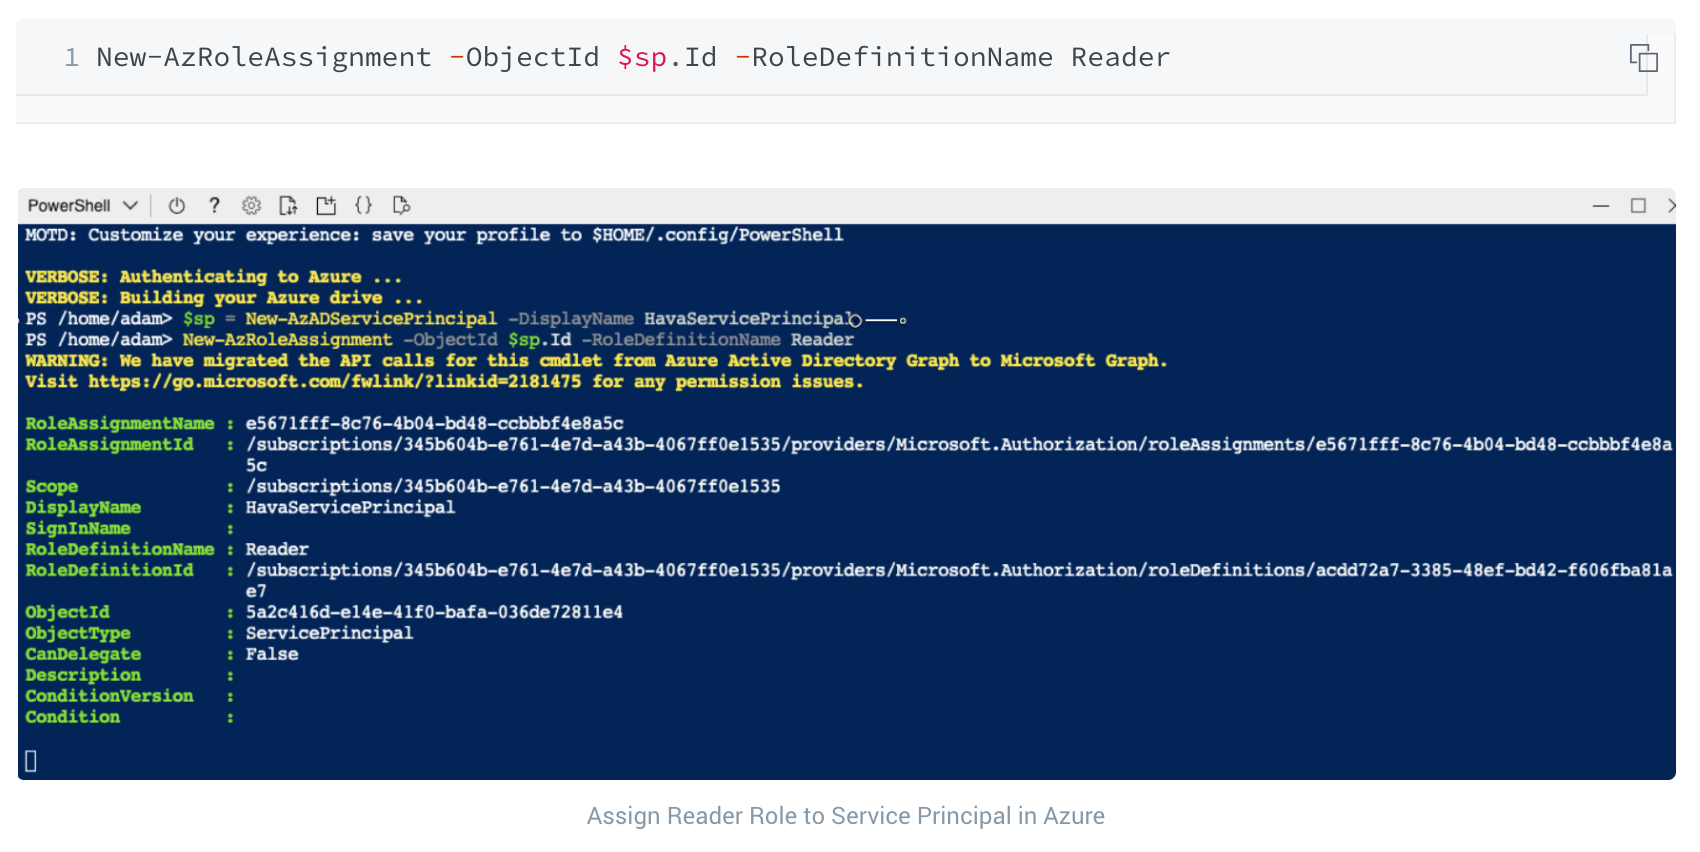
3. Assign Reader Role
Hava only requires read-only access so, you can assign the read-only permissions to the Service Principal account using the below command.
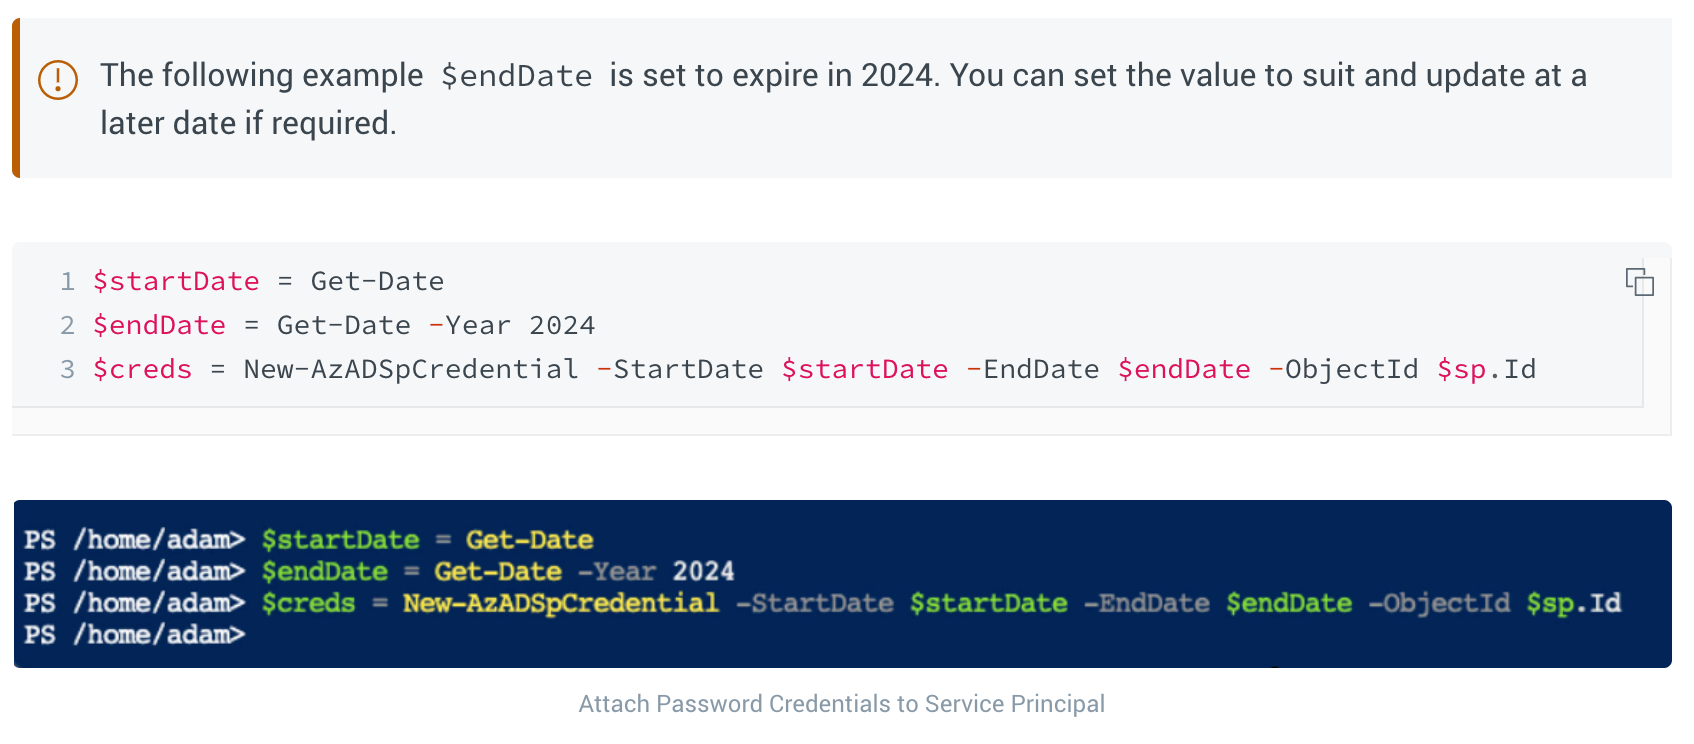
4. Create the Password
Once you’ve created the Service Principal and assigned it with a Reader Role, you need to create password credentials to attach to the Service Principal.
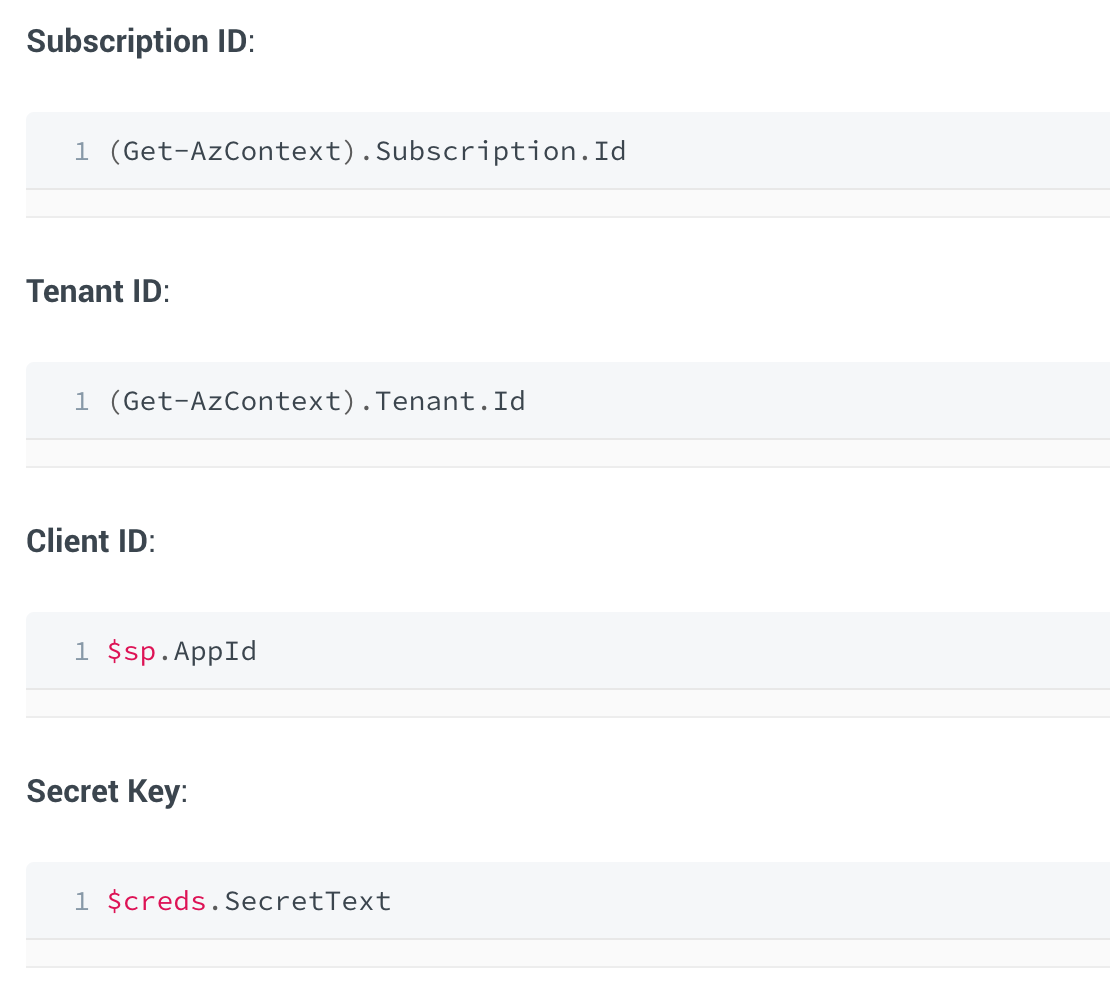
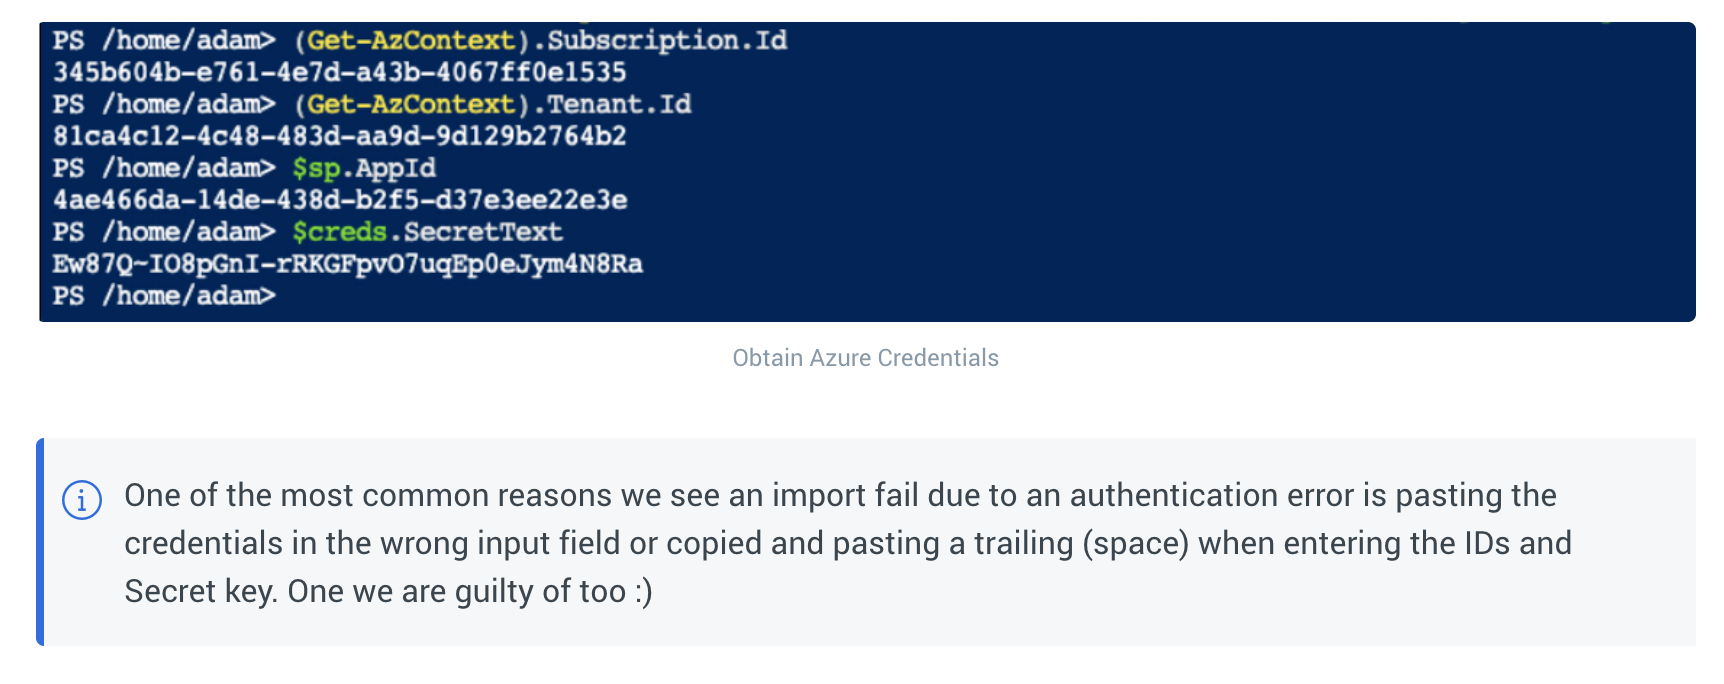
5. Obtaining the Credentials
The final step required is to retrieve the necessary credentials to input into Hava.
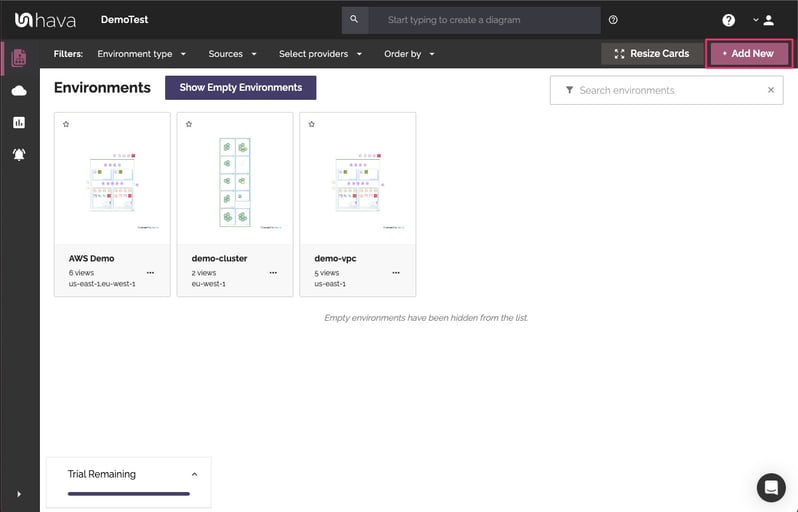
Once you have the required credentials, you can log in to Hava which will open up the environments screen. You then select "Add Environments"
Click on the "Azure" Tab and enter the credentials you have just gathered from your Azure PowerShell.
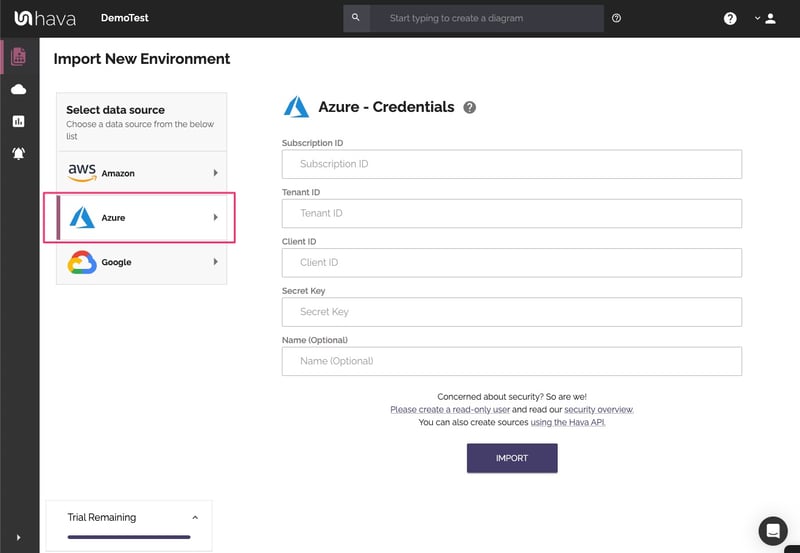
You may at this point optionally name the connection. Hava will import your Microsoft Azure environment, layout the diagram and add the environment tile to the Hava dashboard.
If you are on a Teams plan, you can then place the new data source in a project and assign the team users who need access to the environment diagrams
From this point Hava will periodically sync with your Azure configuration and detect any changes. When changes are found a new diagram is created and the superseded diagram is placed into a fully interactive version history, so you always have an accurate visual representation of your Azure Environment whenever required.
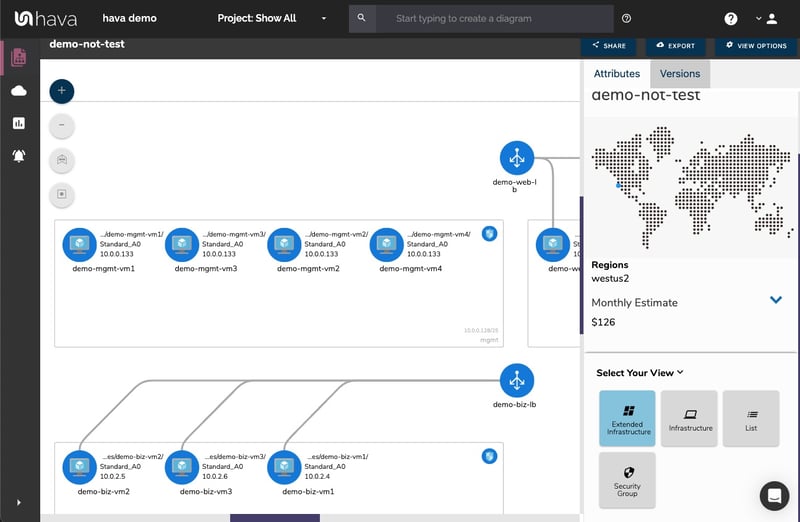
The Microsoft Azure devops diagrams produced are laid out by resource group which typically contain subnets running in virtual networks. All of the resource metadata isn't placed on the diagram, but is displayed in a contextual attribute pane to the right hand side of the diagram.
Connections and resource names can be toggled on or off depending on your preference. The resource names appear under the diagram icons when enabled.
This keeps your Azure environment diagram clean, however this allows you to select the interactive elements of the diagram, like a virtual network, subnet or individual resources like load balancers, gateways, virtual machines, peering connections and storage accounts. When you select a resource on the diagram, all the metadata and settings are displayed to the right hand side of the diagram in the attribute pane. The metadata and settings are contextual to the currently selected element.
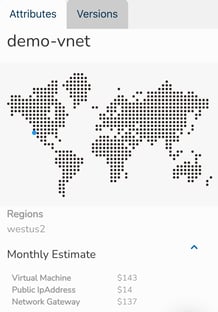
With nothing selected on the diagram, the attribute pane displays information about the entire Azure environment including a usage cost estimate.
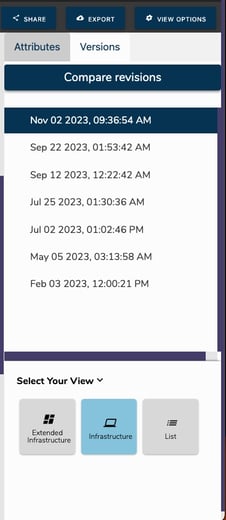
Versioning is one of the most powerful aspects of using Hava as part of your DevOps toolkit. Hava keeps track of the changes detected in your Microsoft Azure configuration via continuous automated polling.
Once a change is detected, a new diagram is created and the superseded diagram is placed in the Hava version history. At any time, you can select older versions to view and they remain fully interactive, not just a static diagram. You can click into resources, inspect attributes and settings and view in extended infrastructure and 3D just as you can on the live diagrams.
If you are trying to diagnose a network problem or change that has caused you applications to fail after an update, selecting an older diagram set, you can pull up the older version in a separate browser and compare current diagrams side-by-side so you can visually detect the differences.
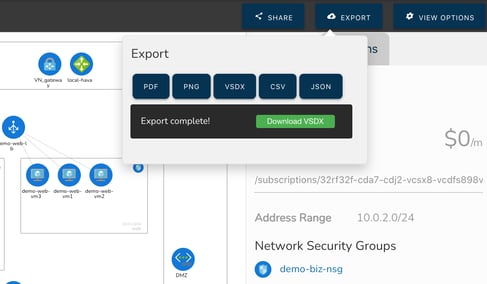
If your environments are large or complex, you can also export current and superseded diagrams in JSON format and Diff the files to surface all the changed resources and settings .
All the interactive diagrams are exportable in a number of formats.
Hava continuously scans your Azure architecture and when changes are detected a new diagram set is automatically generated. The superseded diagrams are not discarded or overwritten. Instead they are moved into version history. Still fully interactive.
What this means is you can view your cloud architecture at any point in time and also leverage Hava's revision comparison (Diff Diagrams) to quickly identify what has been added or removed between the two diagram dates.
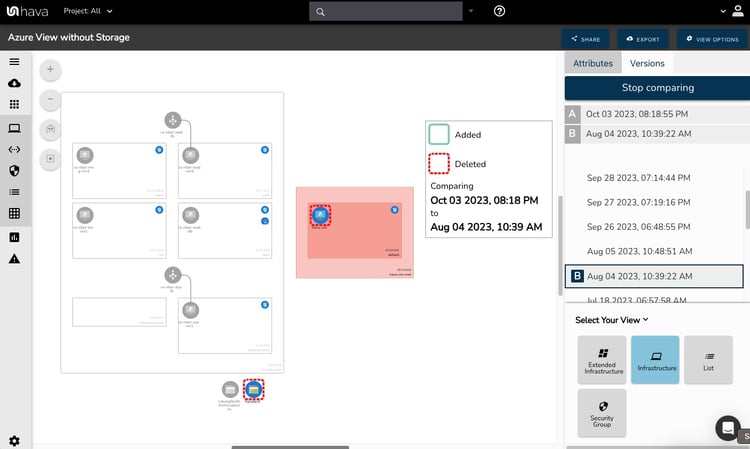
So you can easily identify all the changes made since your last compliance audit, or see what changed yesterday that is causing unexpected network or application errors.
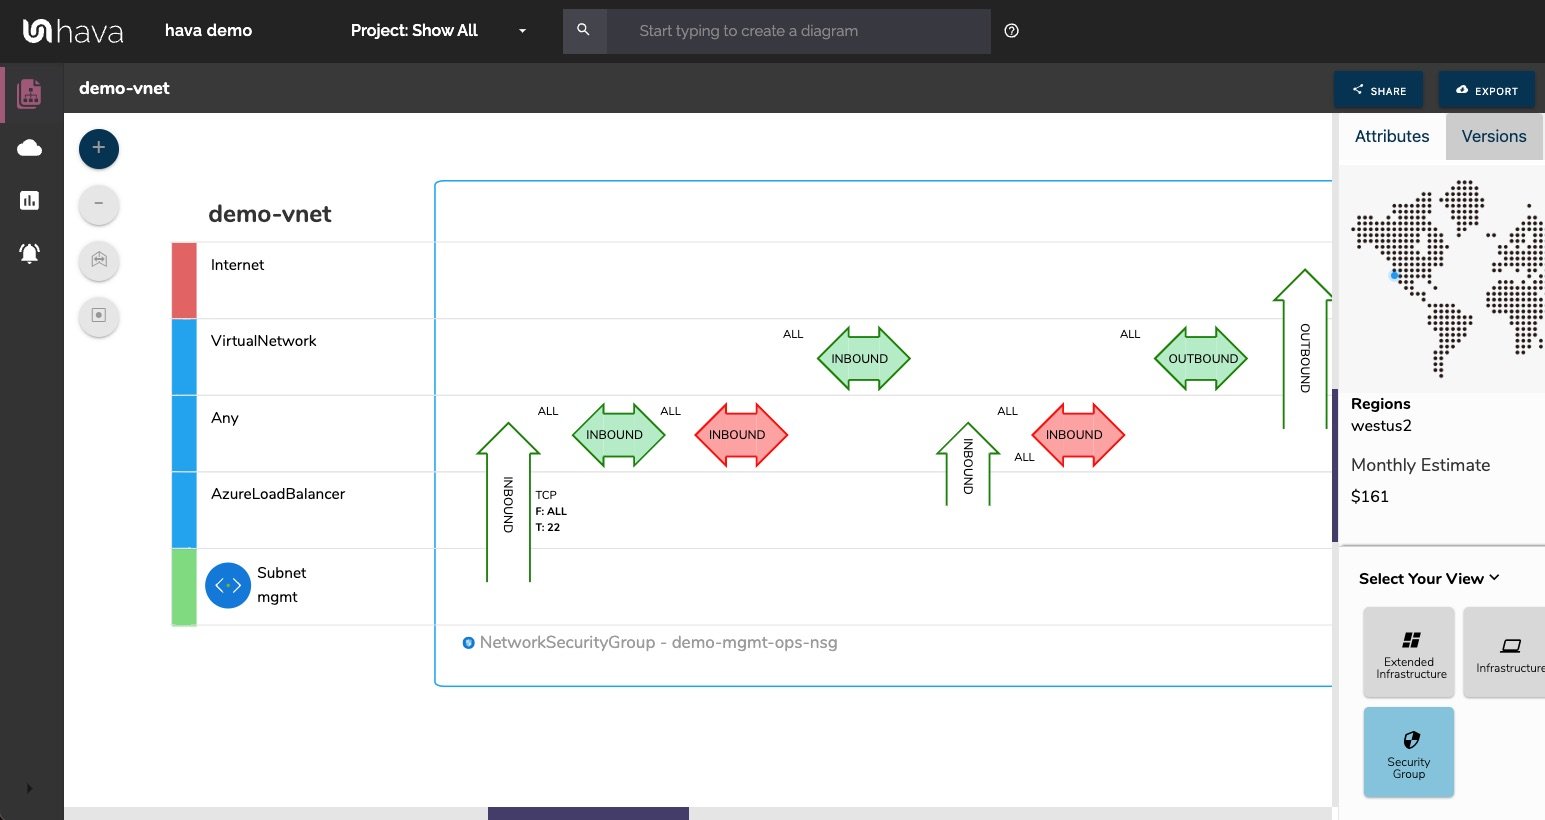
Azure Security View
Hava also produces a security view for Azure. This details the configured security groups and traffic flows so you can see how users can enter your architecture and see what they can access
While diff diagrams are super helpful in diagnosing changes after the fact, you may want to keep on top of changes as they happen.
Hava's architecture monitoring alerts will let you know the minute a change is detected. You simply nominate the environment you wish to monitor and add a group of recipients to receive the alerts. When a change is detected like the addition or removal of a resource, Hava will send each recipient a diff diagram showing the changes.

Now you and your security team can be across every change as it happens so you can assess and take action if required.
There is currently no way within Hava to draw diagrams from scratch or to add or remove elements. This is because native Hava diagrams are designed to always reflect the source of truth at any point in time. You can alway be confident that what you are looking at on the Hava diagram accurately reflects reality. This is because there is no way to add or remove diagram elements, resources and metadata that could lead to confusion or mis-represent the state of the network during a security or compliance audit for instance.
We do however appreciate that sometimes you would like to use your Hava Azure network diagram as a starting point for some redesign work, or you would like to annotate a diagram to explain elements of the diagram in management or sales presentations.
To facilitate that scenario, Hava provides:
The VSDX export option is the solution that enables you to export your Microsoft Azure infrastructure diagrams in Visio format. You can then use Visio or a compatible application like draw.io (diagrams.net) to import the diagram for manipulation.
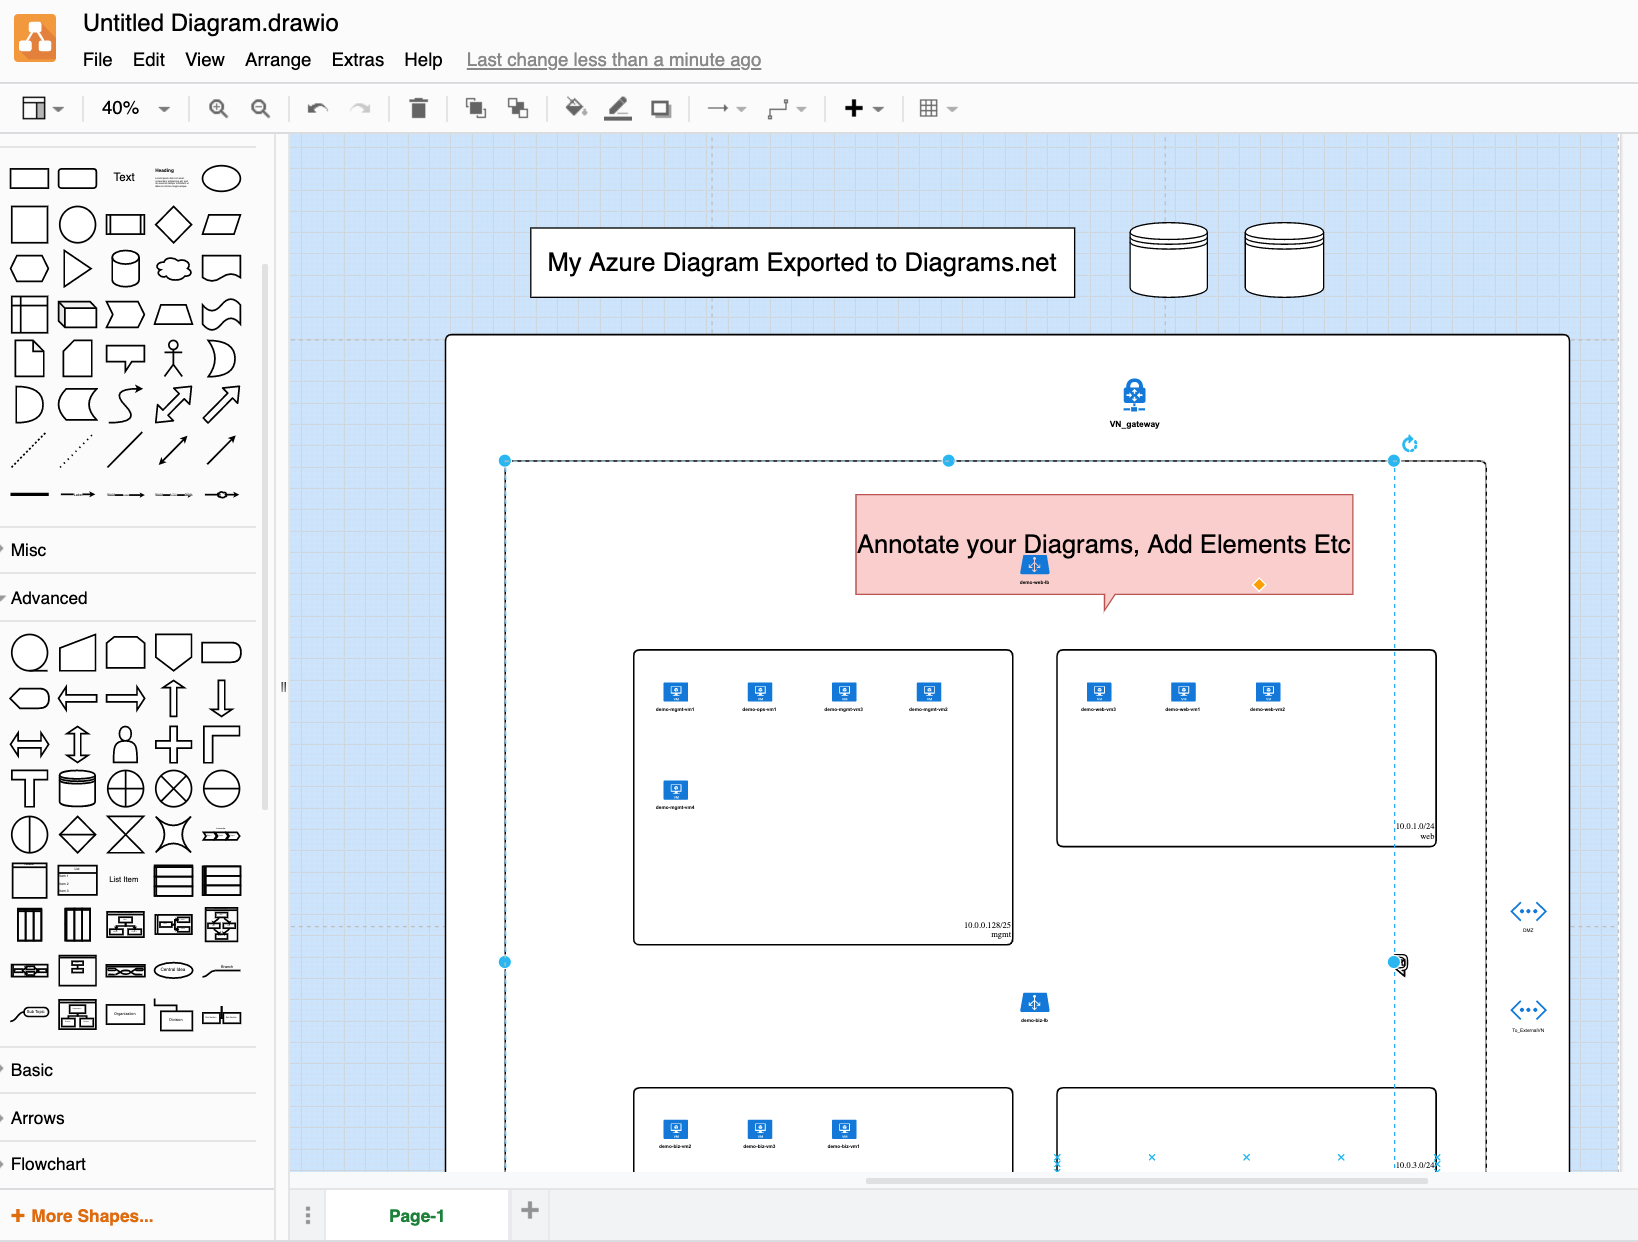
This provides exported editable diagrams while also maintaining the integrity of the diagrams and data held within the Hava ecosystem, so you have an unquestionable source of truth reference retained within your Hava account for use during a PCI compliance, Insurance, security or other type of audit.
On top of the standard infrastructure and security diagrams, there are two more diagrams for Azure that are automatically produced by simply connecting your Azure account to Hava.
The extended infrastructure view is similar to the infrastructure view, however it adds some more information to the diagram like full resource names, IP addresses and resource sizes.
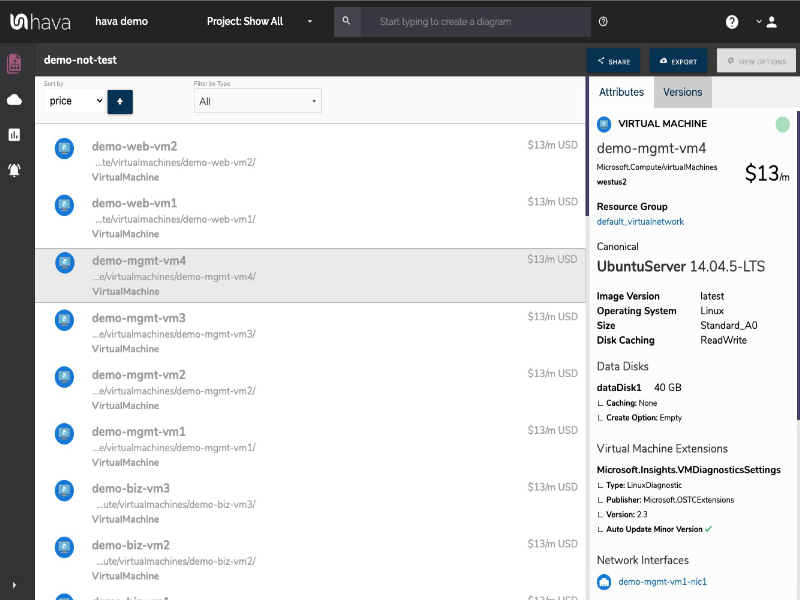
The final Azure diagram is the "List View" . This diagram is more like a report and as the name suggests, is a list which contains of all the resources discovered in your environment.
This includes elements discovered in your data source that are not visualised on the diagrams. Some resources may have dozens of unimportant instances like network interfaces or virtual machine extensions, which add very little to the understanding of how the network is constructed and which if visualised could make the diagrams difficult to read.
The list view is where you can find these resources. The list can be filtered, sorted by name, type or price and exported to CSV for easy import into a spreadsheet that can be used for cost analysis. The list view also includes the resources that are visualized on the infrastructure view.
The visualised Microsoft Azure Diagram resources are detailed below.
|
|
Visualised |
Not Visualised |
|
Application Gateway |
✓ |
|
|
Availability Set |
|
✓ |
|
Express Route |
✓ |
|
|
Load Balancer |
✓ |
|
|
Local Network Gateway |
✓ |
|
|
Network Interface |
|
✓ |
|
Network Security Group |
|
✓ |
|
Public IP |
|
✓ |
|
Redis Cache |
✓ |
|
|
Resource Group |
✓ |
|
|
Route Table |
✓ |
|
|
SQL Server |
✓ |
|
|
Storage Account |
✓ |
|
|
Subnet |
✓ |
|
|
Virtual Machine |
✓ |
|
|
Virtual Machine Extension |
|
✓ |
|
Virtual Machine Scale Set |
|
✓ |
|
Virtual Network |
✓ |
|
|
Virtual Network Gateway |
✓ |
|
|
Virtual Network Peering |
✓ |
|
Hava.io provides a fast, efficient and accurate method of generating and maintaining your Microsoft Azure DevOps diagrams automatically, providing you better internal communications, the ability to surface resources you may not have known were running and to be able to respond to events and outages using a safe repository of network configuration history.
Hava.io also polls your settings continuously and automatically updates your diagrams when changes are detected, providing always up to date hands-free Azure Infrastructure diagrams.

If you are not using Hava yet to document your Azure cloud environments, you are welcome to try a 14 day free trial, absolutely no obligation or pressure and no credit card required to sign up. Learn more here:
Microsoft Azure diagrams are a useful tool when building or managing Azure Cloud infrastructure. Here's how to Automate the process.
Microsoft Azure diagrams are an essential tool when building or managing Azure Cloud infrastructure. Here's how to Automate the process.
Microsoft Azure diagrams are an essential tool when building or managing Azure infrastructure. Here's how to automate the process online.