Automated Diagrams
Simply connect your Microsoft Azure account to Hava and your infrastructure is automatically diagrammed.


Simply connect your Microsoft Azure account to Hava and your infrastructure is automatically diagrammed.

Once connected, Hava continuously polls your Azure account and updates your diagrams when changes are detected.

Your superseded infrastructure diagrams are retained in a fully interactive & exportable form.
There are numerous reasons to accurately document your cloud infrastructure. Enabling key stakeholders to fully understand your cloud architecture is easily achieved with a good set of accurate interactive diagrams. Which means new engineers and external consultants don't waste valuable time working out what you have configured.
Creating a set of Azure Architecture Diagrams using Hava is as simple as creating a set of read-only credentials in power shell and entering them into Hava.
Hava will create a set of diagrams based on the discovered resource groups in your Azure account.
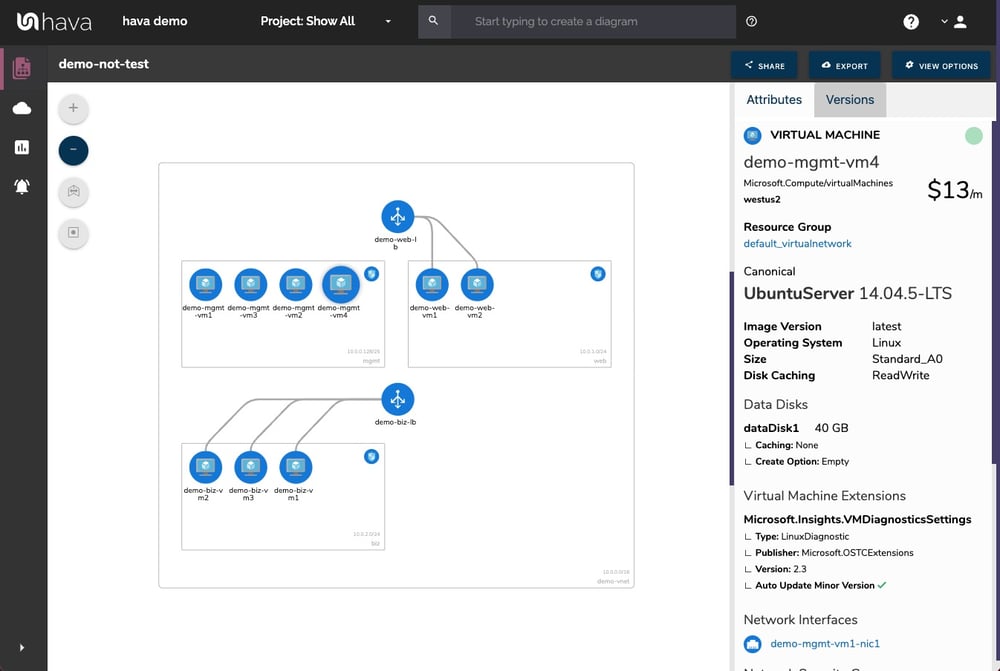
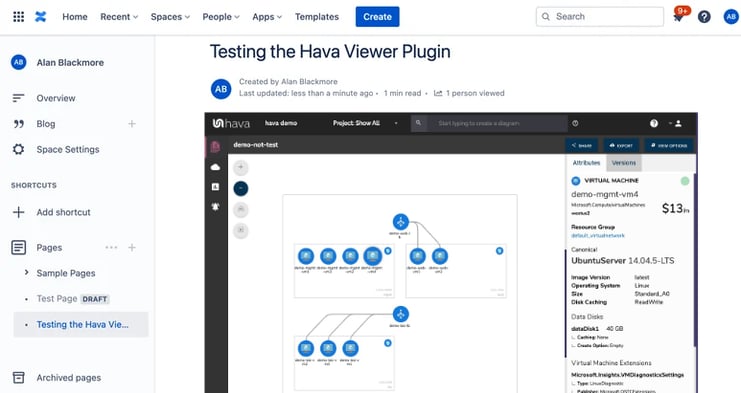
The "Infrastructure View" diagram that is automatically created, logically lays out your Azure environment for each discovered resource group. Each Virtual Network is visualized and contains subnets and the resources they contain. Resources external to the virtual networks such as virtual or local network gateways, network peering connections and storage accounts are visualised outside of the virtual network border.
Each diagram is interactive, in that selecting a resource group, virtual network or individual resource will change the contextual attributes pane to the right of the diagram to show metadata pertaining to the selected item.
Selecting the resource group for instance will detail network security groups, security rules, subnets, virtual machines, IP configs, network interfaces, virtual machine extensions, load balancers, routes, local network gateways, probes, availability sets and storage accounts.
Automatically generating Azure architecture diagrams ensures you have accurate documentation. However they are only accurate until the next configuration change. Hava continuously syncs your standard and custom diagrams, so an up-to-date documentation set is always at hand. Should you need "up to the second" updates, you can manually sync your data sources at any time to build a fresh set of diagrams on the fly using the Hava Console, Hava's CLI, API or using one of the many pipeline integrations such as Terraform or GitHub..
Visualized Resources Include:
| Application Gateways | Local Net Gateway | Network Route | Storage Accounts | Virtual Network |
| Express Routes | Redis Cache | Route Tables | Subnets | VN Gateways |
| Load Balancers | Resource Group | SQL Server | Virtual Machines | VN Peering |
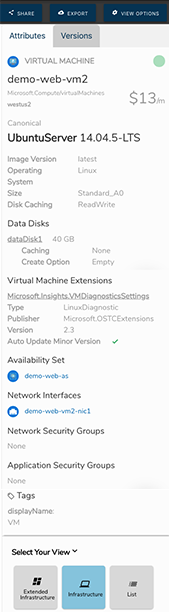
Selecting an individual resource on your interactive diagram will display the associated attribute metadata in the attribute pane to the right of the diagram.
This ensures you can quickly see all the associated connections and settings related to the selected resource without having to exit to your Azure Portal.
The same goes for selecting an entire virtual network or subnet. All the associated settings like network security groups or route tables are displayed in the attribute pane.
Within the attribute pane, some attributes are also selectable. Clicking on the selectable attribute will display even more data related to that attribute, which includes resources not visualised on the diagrams like network interfaces.
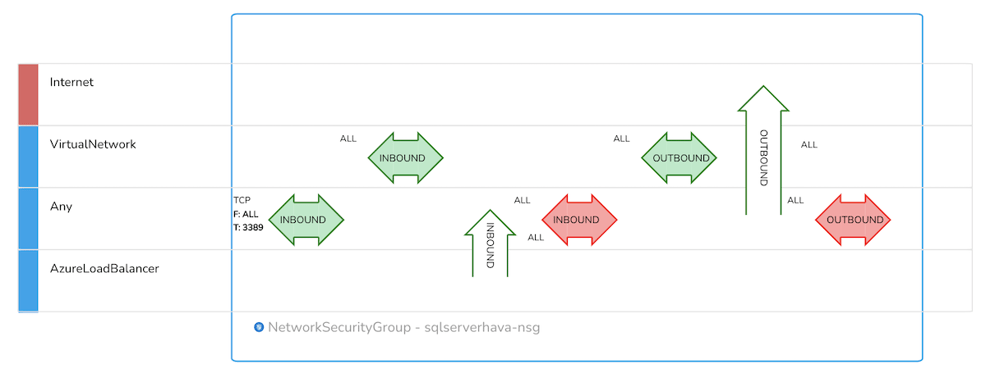
One of the most important aspects of cloud computing solutions is security and security should be a central component of your Azure diagram toolset.
Visualizing your Azure security configuration allows your security team to immediately see what security groups have been set up, what they control, what ports are open and how IP traffic enters and exits your network.
A visualized security configuration can instantly highlight vulnerabilities like open ports or network ingress points that have been misconfigured. Your security team can potentially pick up problems in seconds that would otherwise go unnoticed or take hours to uncover trawling through console settings.
While automatically generated Azure diagrams delineated by Virtual Network are incredibly useful and time saving, sometimes you need to diagram specific elements within your VPC or to collate resources from different VPCs or even different cloud providers.
Hava's toolset addresses this with a very flexible query and search tool that allows you to build custom diagrams based on numerous criteria like region, resource name, VPC name and even arbitrary tags.
This enables you to customise diagrams to just include the key information you need that is dynamic and ready to view at a glance.
Custom Environment Diagrams can be used to:
Filter and diagram only the specific components of your environment you are interested in viewing
Combine data from separate environments into one diagram
Combine data from separate cloud providers into one diagram
View specific components from multiple sources on the one diagram
The search and filter box at the top of the environments dashboard is the starting point for creating a custom diagram and contains prompts for the available filters.
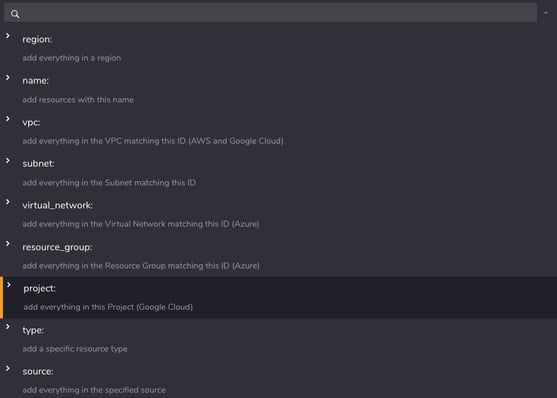
Using the region: search parameter for instance, would return anything in the specified region, including resources in any matching Azure or GCP data sources you have connected to Hava.
Using the Deep Search modifier "@" within the query, the search will also return resources connected to the ones that meet your search criteria.
You can use this feature to quickly locate a resource from within 100's of connected cloud accounts with a single search command.
Your diagrams are constructed using the resources discovered in your connected Azure account. Hava provides the ability to export both the rendered diagrams and the underlaying data in a number of formats.
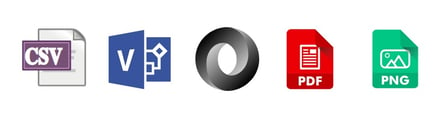
The PDF and PNG option will allow you to export an image of your rendered diagrams.
The Visio (VSDX) export will produce a file you can open in Microsoft Visio other compatible applications like draw.io and make edits to your infrastructure diagrams. Hava maintains 100% accurate diagrams by only building diagrams based on existing running resources that can be referenced for audit and compliance purposes. If you need to diagram proposed changes or add annotations to your diagrams, then the VDSX export provides this flexibility.
The third available type of export is the data in both CSV and JSON formats. This allows you to process the data using whatever methods you prefer. A typical use case would be to export the current infrastructure data to compare with a previous version to quickly identify changes.
Hava continuously polls your Azure infrastructure looking for changes.
Once a change is detected, Hava automatically generates a new set of diagrams - hands-free.
When a diagram set is superseded, the old version is placed into a Version History. This is a fully functional interactive diagram set with all the associated metadata and attributes also archived.
This means you can open it up just like the live infrastructure and inspect all the resources as they existed at that point in time.
This is important, especially when responding to an unexpected network event, PCI or insurance audit where you need to prove network integrity from a source of truth.
Versions are automatically generated whether you have logged into your Hava account or not, which means if several configuration changes occur in between logins, you will be able to establish exactly what changed and when.

One of the unique features of Hava is the ability to compare any two diagram versions using the Diff View.
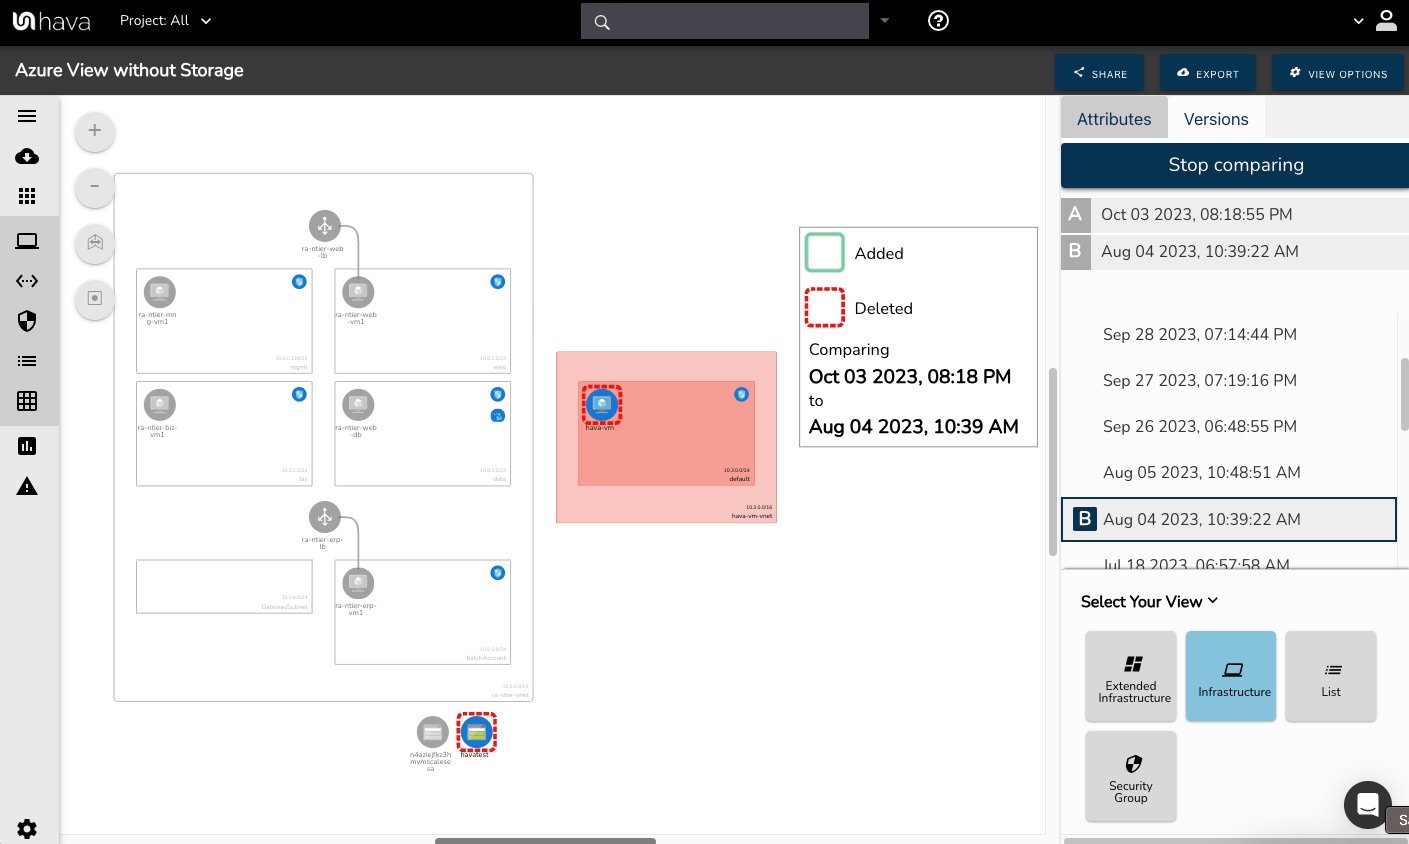
This on demand view shows you exactly what changed between the two architecture diagrams selected (points in time) - You get to see what was added and what was taken away which can be invaluable if you are trying to track down the cause of an outage or unexpected application errors.
When things change in your cloud architecture, you're probably going to want to know about it. Your security team might be quite interested too.
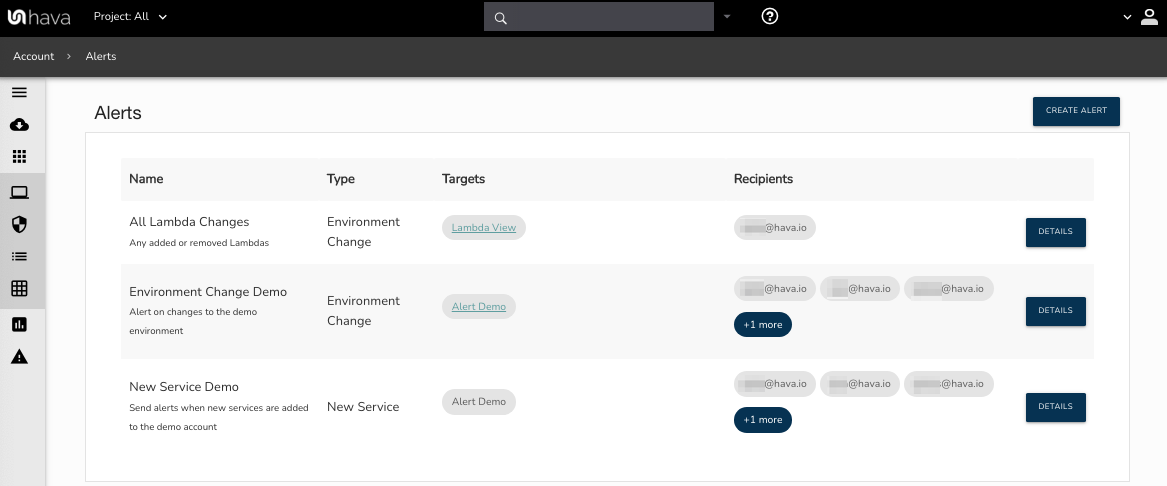
By setting up Alerts in Hava, you can nominate individuals to receive alerts when changes are detected. Alerts are placed in the Hava alerts console and an email is sent to everyone you nominate with a diff diagram showing you the changes that triggered the alert.
You get to know straight away so you can assess the impact on budget, security and application performance. You get to avoid architecture drift or nasty bill shock when the Microsoft invoice arrives at the end of the month.
When you first view your Azure infrastructure diagrams without anything on the diagram selected, the attribute pane will show details for the entire environment.
This includes a "Monthly Estimate" which will detail the resources found in your architecture that attract a usage charge from Azure. The estimate is the published default cost for the resource and may not exactly reflect actual billing.
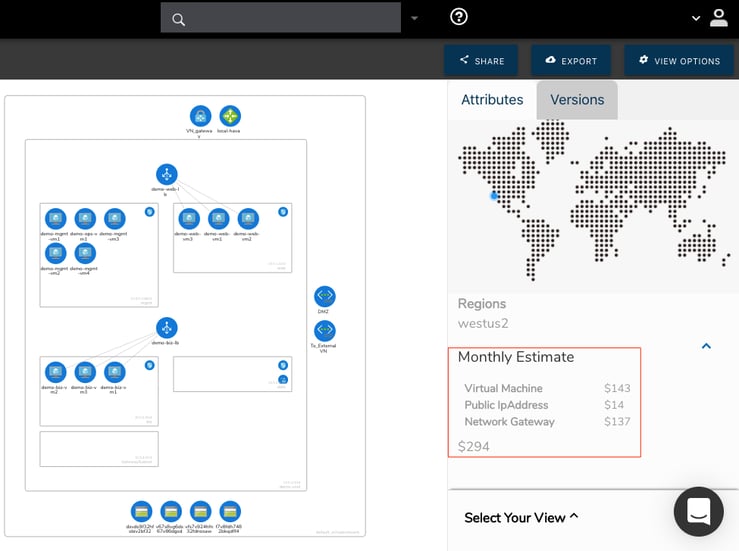
When inspecting individual resources, the individual estimated cost for the resource is displayed in the attribute pane.
Another diagram in the automated Azure diagram set Hava produces when you connect your Azure account in the "List View" which can be used to view and export cost estimates.
The list view is a representation of all the resources discovered in your Azure configuration. This includes resources that are not visualized on your infrastructure diagrams including Availability Sets, Network Interfaces, Network Security Groups, VM Extensions and Scale Sets.
In this view you can sort the list by resource type, resource name and price and filter the list by resource type to just show the resource types you are interested in.
The list view can be exported to CSV and JSON which provides an easy method of sending a list of costed resources to spreadsheet for financial analysis.

Hava provides the ability to generate an iFrame code snippet that allows you to embed your diagrams anywhere that allows iFrames. This means you can provide fully interactive diagrams of your Azure infrastructure without the need for log in credentials or complex API programming.
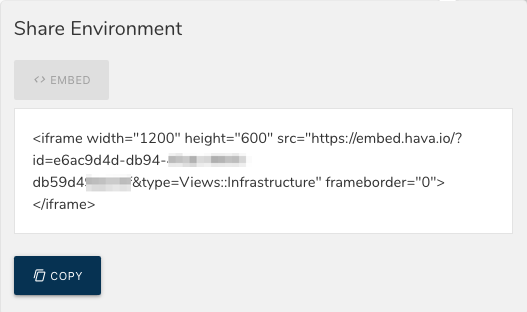
Typically for internal use like Wiki's, intranets, dashboards and support/development tickets the embedded diagrams are fully interactive and will contain the same potentially sensitive data as the diagrams viewed through the Hava application, so caution should be exercised when embedding diagrams outside of your intranet.
Hava has a fully featured API that enables you to pull config data, fire sync requests and any perform number of tasks and functions.
The API can be used to extend Hava's functionality. Customers have documented tasks like adding animated gifs of a network topology diagram as a build pipeline artifact
The API functions include listing and creating environments, fetching and exporting diagrams in various formats, JSON exports, fetching and creating teams and team members and creating, fetching and syncing your AWS, Azure and GCP data sources.
Hava has a fully featured CLI
This will enable you to perform functions like adding new cloud accounts or environments to your Hava account as well as generating and updating diagrams as you deploy resources via IaC or command line scripts.
This delivers absolute real-time architecture and security diagrams without the need to wait for scheduled syncs or having to request updates manually.
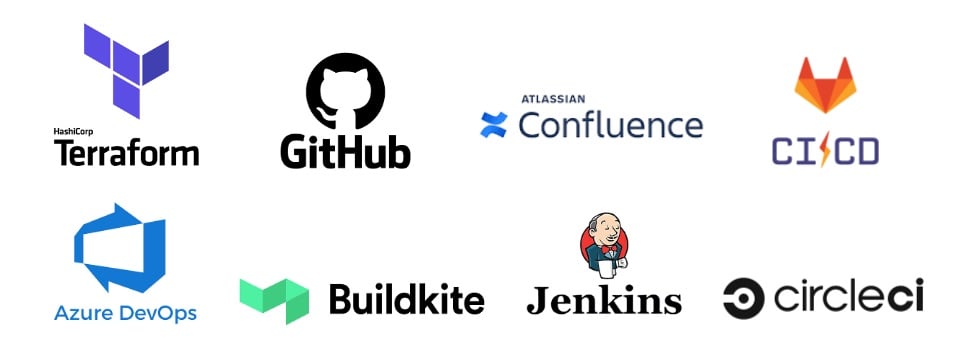
This powerful tool is a CLI binary to interface with the Hava API so that cloud practitioners to script commands inside pipeline tools like:
Leveraging Hava's CLI ensures your cloud documentation is updated in real-time from right within the CI/CD tools you already use.
There are a number of product specific integrations built by Hava to make integrating or triggering diagrams easy.
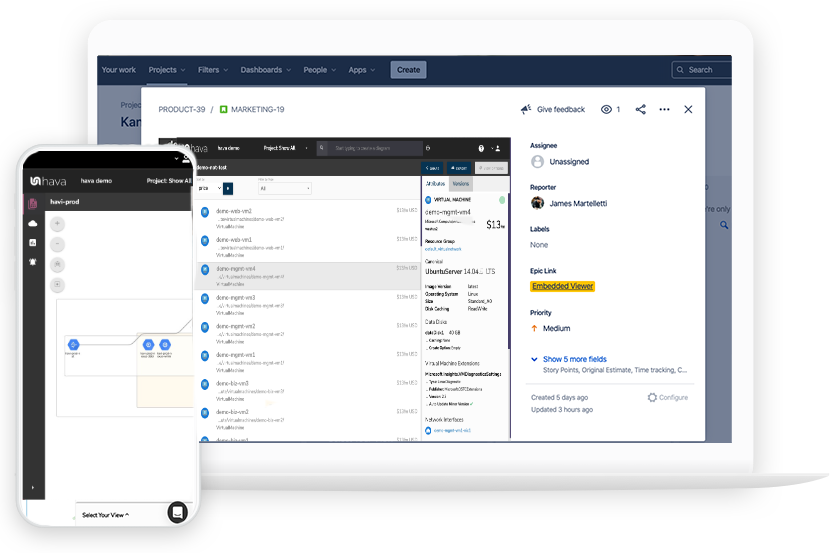
The confluence plug-in allows you to place interactive diagrams directly into your Confluence Wiki.
There are also Terraform provider and GitHub Actions that make it easy to trigger diagram production and retrieval as part of your CI/CD pipeline activity so you can capture architecture states at the point they are deployed.
You can contact us via the live chat widget on the bottom right of this page, or by emailing sales@hava.io. If you would like an indepth run through of Hava, we would be happy to arrange a one-to-one screenshare demonstration where we can discuss your use-cases and answer all your questions.
If you would like to jump right in and try Hava for yourself, we offer a 14 day free trial (no credit card required) where you can import demo data or connect directly to your Azure account