
AWS Infrastructure View
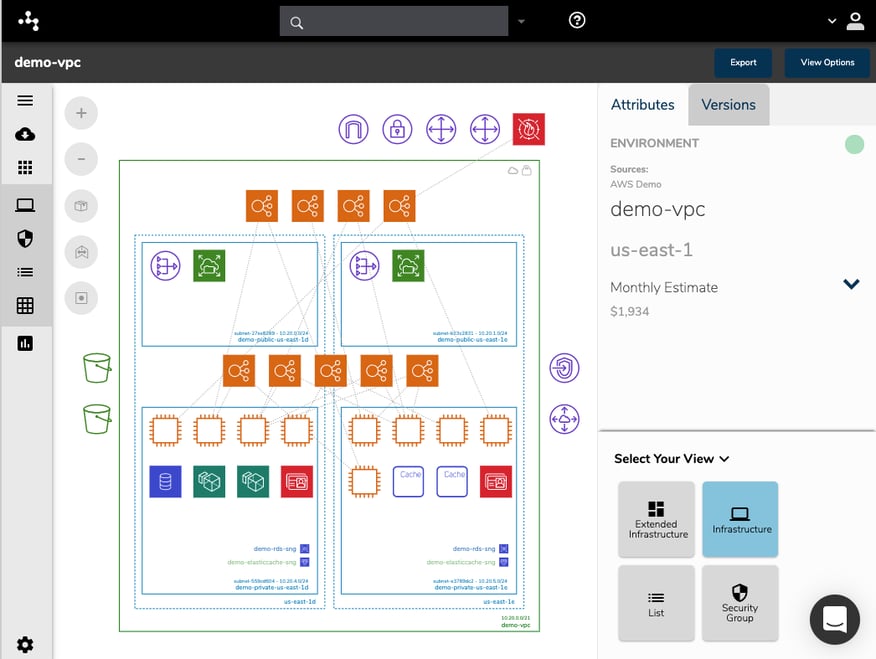
Your AWS network will be visualized by logicially laying out one VPC per diagram. The AWS regions discovered are represented by the columns within the VPC. Each region will contain your subnets configured within each region.
With your environment visualised in this "Infrastructure View" you can select items and resources displayed on the interactive diagram to dig into the attributes of the selected resource, subnet or VPC.
This view gives you a visual prompt in relation to the regional redundancy built into your network design. Can your application survive an individual region outage?
You are able to optionally display resource names and connections which by default are not displayed to keep the diagram uncluttered. There are manual canvas controls to scale and adjust the diagram. The standard infrastructure view out of the box provides the key information needed by Engineers, DevOps and Management and saves you hours or even days of tedious drag and drop diagramming.
Being automated, your diagrams will reflect exactly what is running now in an easy to understand environment visualization.
Far from being a static diagram, all the diagrams and reports created by Hava are fully interactive. Clicking on a VPC, Subnet or individual resource will change attribute pane on the side of the diagram to display contextual information about the resource you just selected.
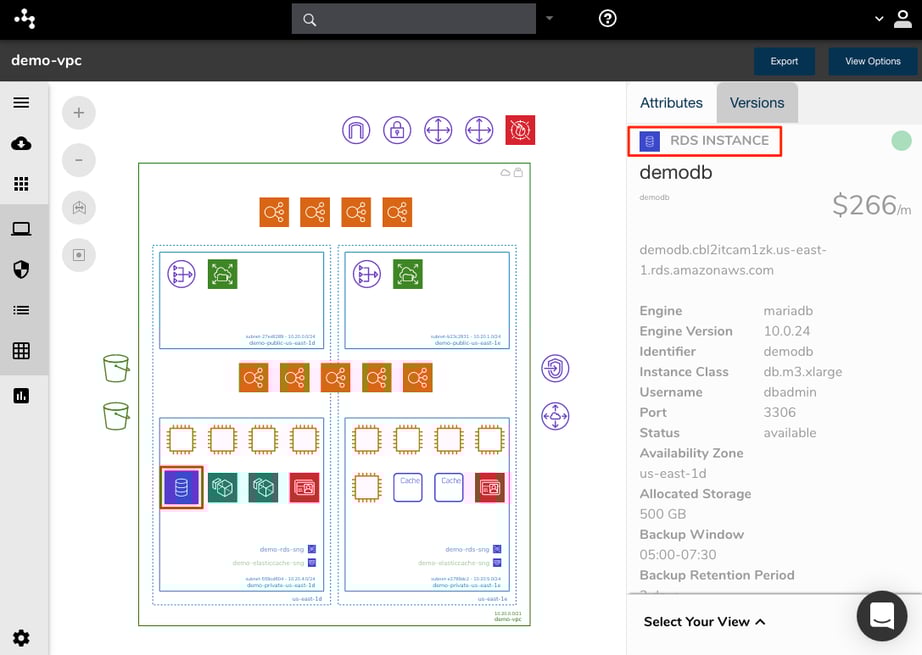
Should there be settings or items in the attribute pane that are selectable, doing so will reveal further information and details about that resource. When viewing the attributes of a top level VPC for instance, the security groups will be shown. Hovering over a security group name will highlight on the diagram all the resources that belong to that group.
Similarly, clicking on the security group name will change the contents of the attribute pane to the attributes of the selected security group. This means that you can save valuable time by viewing attributes and deeper information about your visualized resources directly on the diagram without having to exit out to your AWS console.
There is also an "Extended Infrastructure View" that details more information on the diagram like external and internal IP addresses, full resource names, file storage capacities and a "List View" that provides a sortable list of all the discovered resources that is exportable. The list view data will contain items like network cards and rule sets that are not visualised on the diagrams.
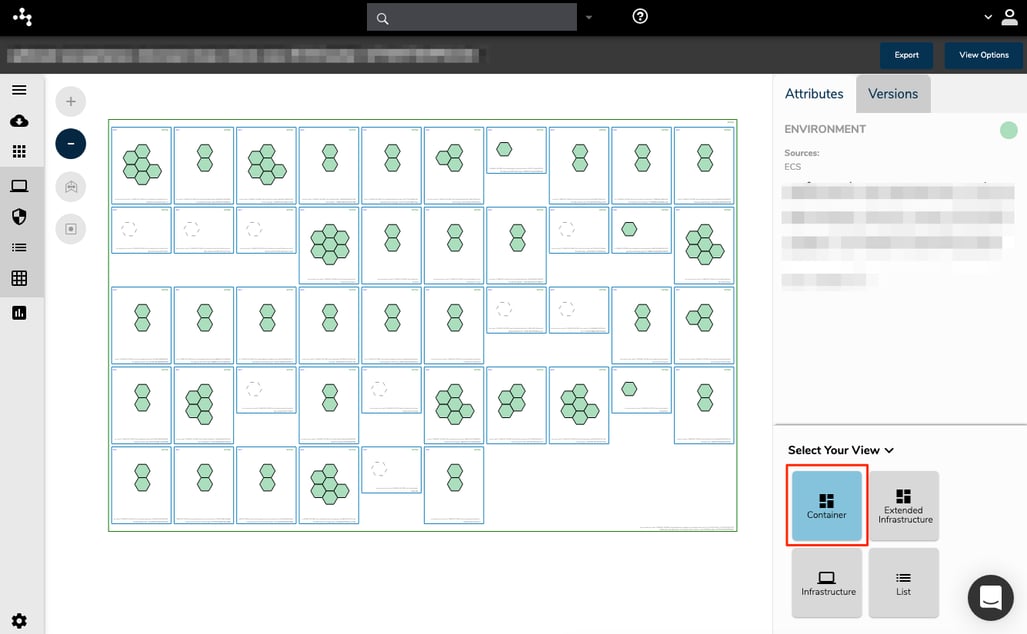
If you are building containerised solutions using AWS, Hava will visualise these in a "Container View" diagram.
The below diagram depicts an ECS Cluster with multiple ECS Service instances within the cluster that contain multiple tasks per service. The task status is represented by different colours for "Running", "Pending", "Stopped" etc
Colour codes include Green = OK, Yellow = Transitioning, Red = Warning, White = Stopped or Empty which gives you an immediate visual guide of exactly what's going on and if anything needs attention.
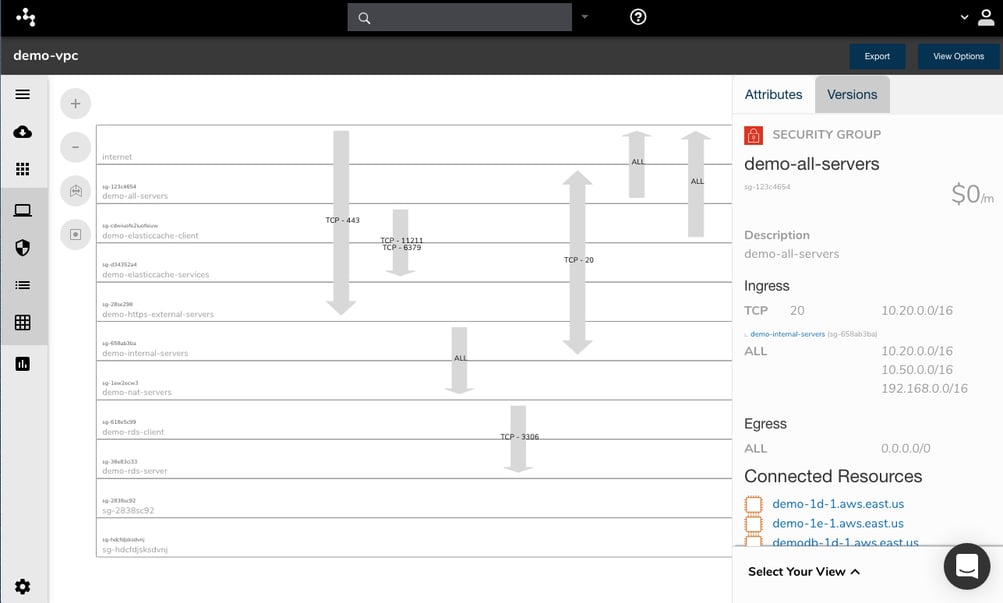
One of the most important aspects of cloud computing solutions is security and security should be a central component of your AWS diagram toolset.
Visualizing your AWS security configuration allows your security team to immediately see what security groups have been set up, what ports are open and how IP traffic enters and exits your network.
A visualized security configuration can instantly highlight vulnerabilities like open ports or network ingress points that have been misconfigured. Your security team can potentially pick up problems in seconds that would otherwise go unnoticed or take hours to uncover trawling through console settings.
While automatically generated AWS diagrams delineated by VPC are incredibly useful and time saving, sometimes you need to diagram specific elements within your VPC or to collate resources from different VPCs or even different cloud providers.
Hava's toolset addresses this with a very flexible query and search tool that allows you to build custom diagrams based on numerous criteria like region, resource name, VPC name and even arbitrary tags.
This enables you to customise diagrams to just include the key information you need that is dynamic and ready to view at a glance.
Custom Environment Diagrams can be used to:
Filter and diagram only the specific components of your environment you are interested in viewing
Combine data from separate environments into one diagram
Combine data from separate cloud providers into one diagram
View specific components from multiple sources on the one diagram
The search and filter box at the top of the environments dashboard is the starting point for creating a custom diagram and contains prompts for the available filters.
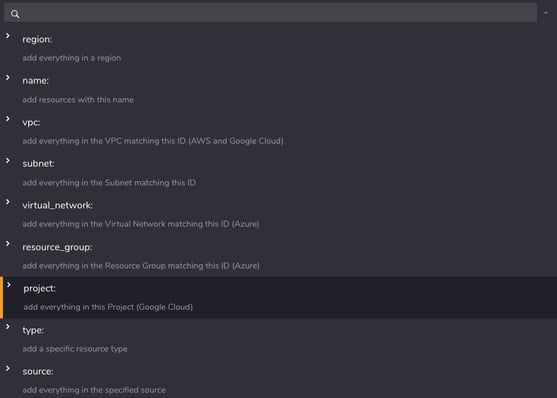
Using the region: search parameter for instance, would return anything in the specified region, including resources in any matching Azure or GCP data sources you have connected to Hava.
Using the Deep Search modifier "@" within the query, the search will also return resources connected to the ones that meet your search criteria.
Automatically generating AWS network topology diagrams ensures you have accurate documentation. However they are only accurate until the next configuration change. Hava continuously syncs your standard and custom diagrams, so an up-to-date documentation set is always at hand. Should you need "up to the second" updates, you can manually sync your data sources at any time to build a fresh set of diagrams on the fly.
While automatically updated AWS diagrams ensure your documentation is always up to date, you may need to know what your network looked like prior to the configuration change. During an audit or unexpected network behaviour you may need to know what the config looked like last month or even 3 months ago.
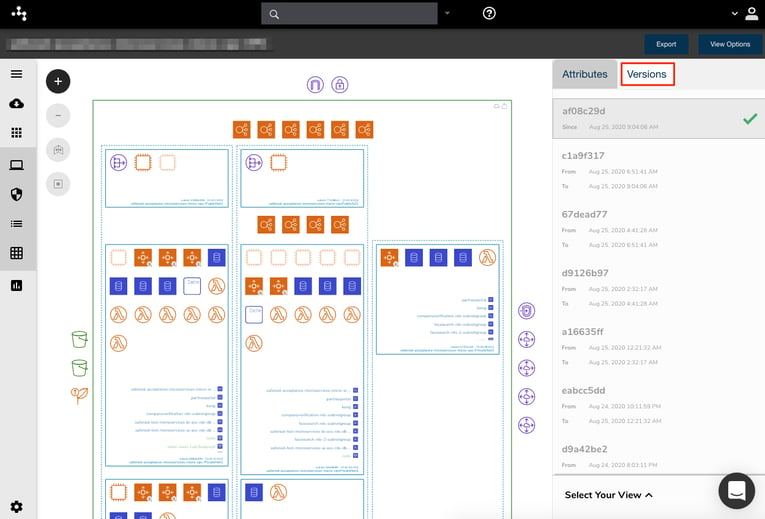
Hava addresses this important requirement by retaining a full interactive document set every time a diagram is superseded. The superseded document set is retained in a version history. The older versions can be opened and inspected interactively just like the current document set and even exported for diffing or external archiving.
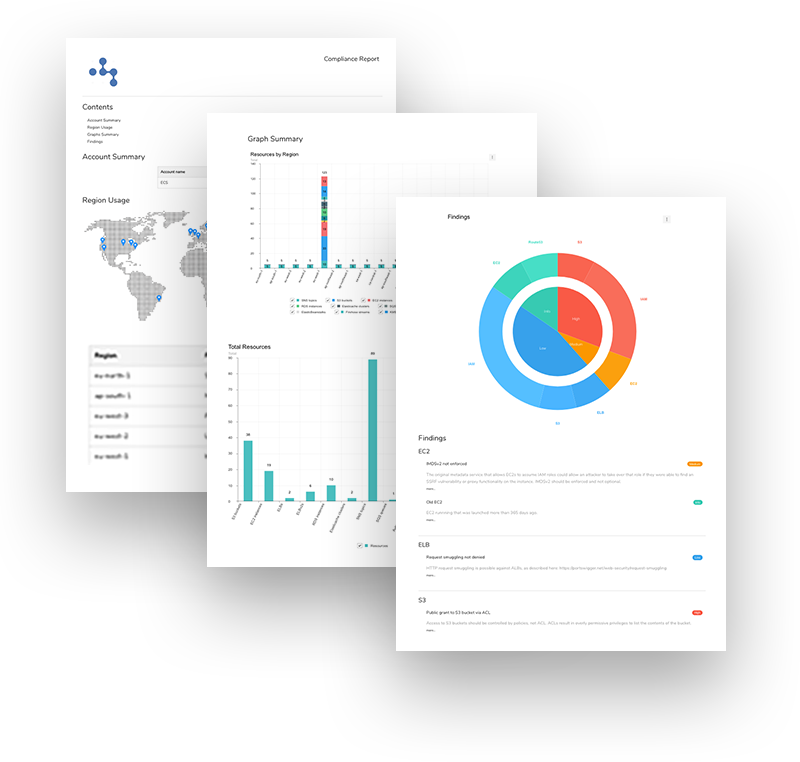
In addition to the traditional diagram set you would expect from an AWS diagram application, Hava also includes an AWS compliance report. This management style report is based on the AWS trusted advisor methodology.
The AWS Compliance report includes an account summary, region usage analysis, interactive graphs covering resources by region, total resources in use, IAM users and roles and finally a report segment on AWS compliance.
The findings will highlight configuration issues and tag them as low, medium or high concerns and will detail the findings and suggested best practice resolutions.
The reports are automatically generated and can be exported on demand.
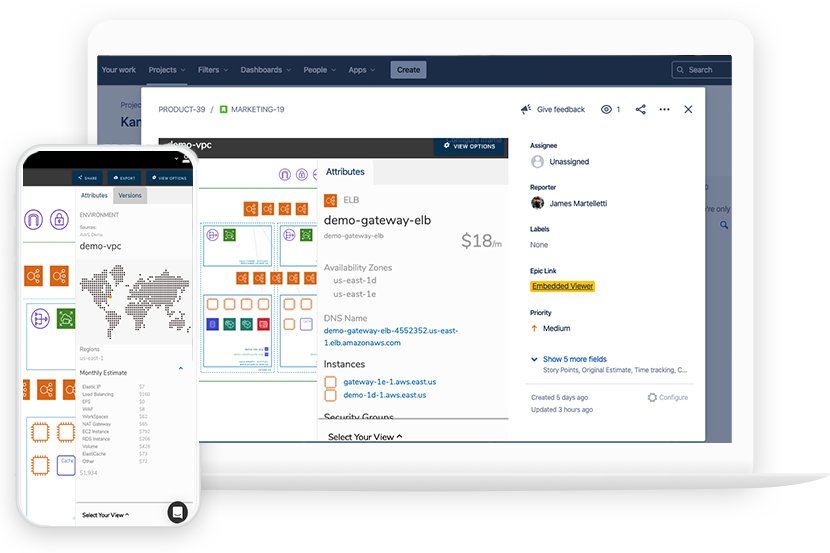
Hava provides an iframe code generator that allows you to embed a fully interactive diagram anywhere that allows iframes. This allows you to provide access to diagrams without API calls, log in credentials, or complex code.
Typically used for intranets, wikis, documentation, development cards, support tickets, and dashboards.
Hava has a fully featured API that enables you to pull config data, fire sync requests and any perform number of tasks and functions.
The API can be used to extend Hava's functionality. Customers have documented tasks like adding animated gifs of a network topology diagram as a build pipeline artifact
The API functions include listing and creating environments, fetching and exporting diagrams in various formats, JSON exports, fetching and creating teams and team members and creating, fetching and syncing your AWS, Azure and GCP data sources.
Hava provides an export function on each diagram type so you can export your diagrams and the underlying data out to your preferred destination.
These options include:
The export function, and in particular the VSDX export provides the ability to edit and embellish your diagrams outside of the Hava application.
Hava does not provide the ability to add or remove elements from automatically generated diagrams in order to maintain 100% accurate diagrams and version history within the application for audit and compliance purposes.
The Hava SaaS is ready for you 24/7. Simply pick a plan and you'll be set up with a free trial within seconds.
Create a set of read-only credentials and connect your cloud to Hava.
Within a few minutes Hava will map your cloud configuration and produce a full set of interactive diagrams.
You can access a free 14 day trial to any of the available SaaS plans via the button below. No credit card required.

In some circumstances your enterprise cloud security or internal policies prevent connecting to external 3rd party applications. Also geographical data storage considerations can dictate where you can store data in some localities. The solution to this is Hava's self-hosted enterprise solution that enables you to host and operate Hava within your network.
Please talk to us if self-hosted is your preferred option.
Hava fully automates your AWS diagramming and documentation, by producing accurate diagrams that can be used for compliance and audit purposes, can help you understand your network visually, help you on-board new engineers faster and assist your security team quickly identify vulnerabilities.
If you would like a personal walk through Hava to see how it can help you in your day-to-day AWS cloud management and documentation challenges, we would be happy to arrange a one-on-one screen share demonstration with one of our customer success team. If you would like to do that, or just have more questions, please use the chat widget in the bottom right hand corner of this page. It's connected to a real person with in-depth knowledge of the application who will be happy to discuss your use-case or requirements.