Are you 100% confident the AWS, Azure or GCP cloud infrastructure you initially designed is actually what is running right now?
Typically cloud based applications go through a number of distinct phases. From design, build and staging to testing and deployment, there are so many opportunities for your infrastructure hosting to end up with unused or duplicated resources or in some cases entire environments.
It is also not uncommon for ports to be opened up to assist in the development stage that could be problematic once your application is in production and storing real customer data.
With the increasing adoption of hybrid cloud solutions, distributed global teams and dynamic network topology, it takes a great deal of diligence to ensure your cloud infrastructure is locked down and that you are not paying for unused resources that were never part of your initial design.
Take for instance development environments. In almost all cases, development is continuous and the environments spun up to assist with the process continue to be required. However, it may be the case that duplicate environments were created for transient developer teams that were brought in on a short term basis for a specific purpose. At the point their contribution to the code base was adopted (or rejected) and they have moved on, the environments provided for development and testing may no longer be required.
Deployment of a cloud architecture design can also throw up countless reasons why variations are required. These could be both performance or security related requiring the deployment to utilise different resources than initially anticipated.
Once in production, your network topology could be subjected to loads that may not have been anticipated and require additional resources to be scaled or added to. Or conversely, over cautious network design may have provisioned duplicate load balanced resources or oversized resources that turned out not to be required.
New types of resources, faster and faster compute options and completely new methodology announcements seem to be a daily occurrence, with the big three cloud computing infrastructure providers releasing shiny new offerings on a daily basis. This inevitably leads to network redesign and the deployment of updates to the newer, faster, better technology which can lead to unused resources being present & active, but unused.
From a security perspective, you would hope the initial design would have your network and data locked down and well protected. In reality the temptation to open up ports so engineers can access data externally is great, especially when so many engineers are now working remotely or from home. This is ok when applications are in the development stage, however once deployed and live client data is being collected, these network vulnerabilities shouldn't exist.
All of these things will inevitably lead to obsolete resources that can potentially be removed but never are. This can be something as benign as an unused load balancer through to and entire test environment.
Replicated databases that are created "just in case" remain lurking in your console and although your team had every intention on deleting them once the new topology was deployed, sometimes they get missed and stick around for years buried in the hosting account invoice.
Those ports that were opened up to give the dev team weekend access in the run up to launch remain open long after deployment just waiting for a bad actor to find their way in and help themselves to your client's data.
In reality what you "expect" to see when you view your network topology is rarely what is actually running. This is the case for long established infrastructure as much as it is for recently deployed applications.
How do you compare expectations to reality?
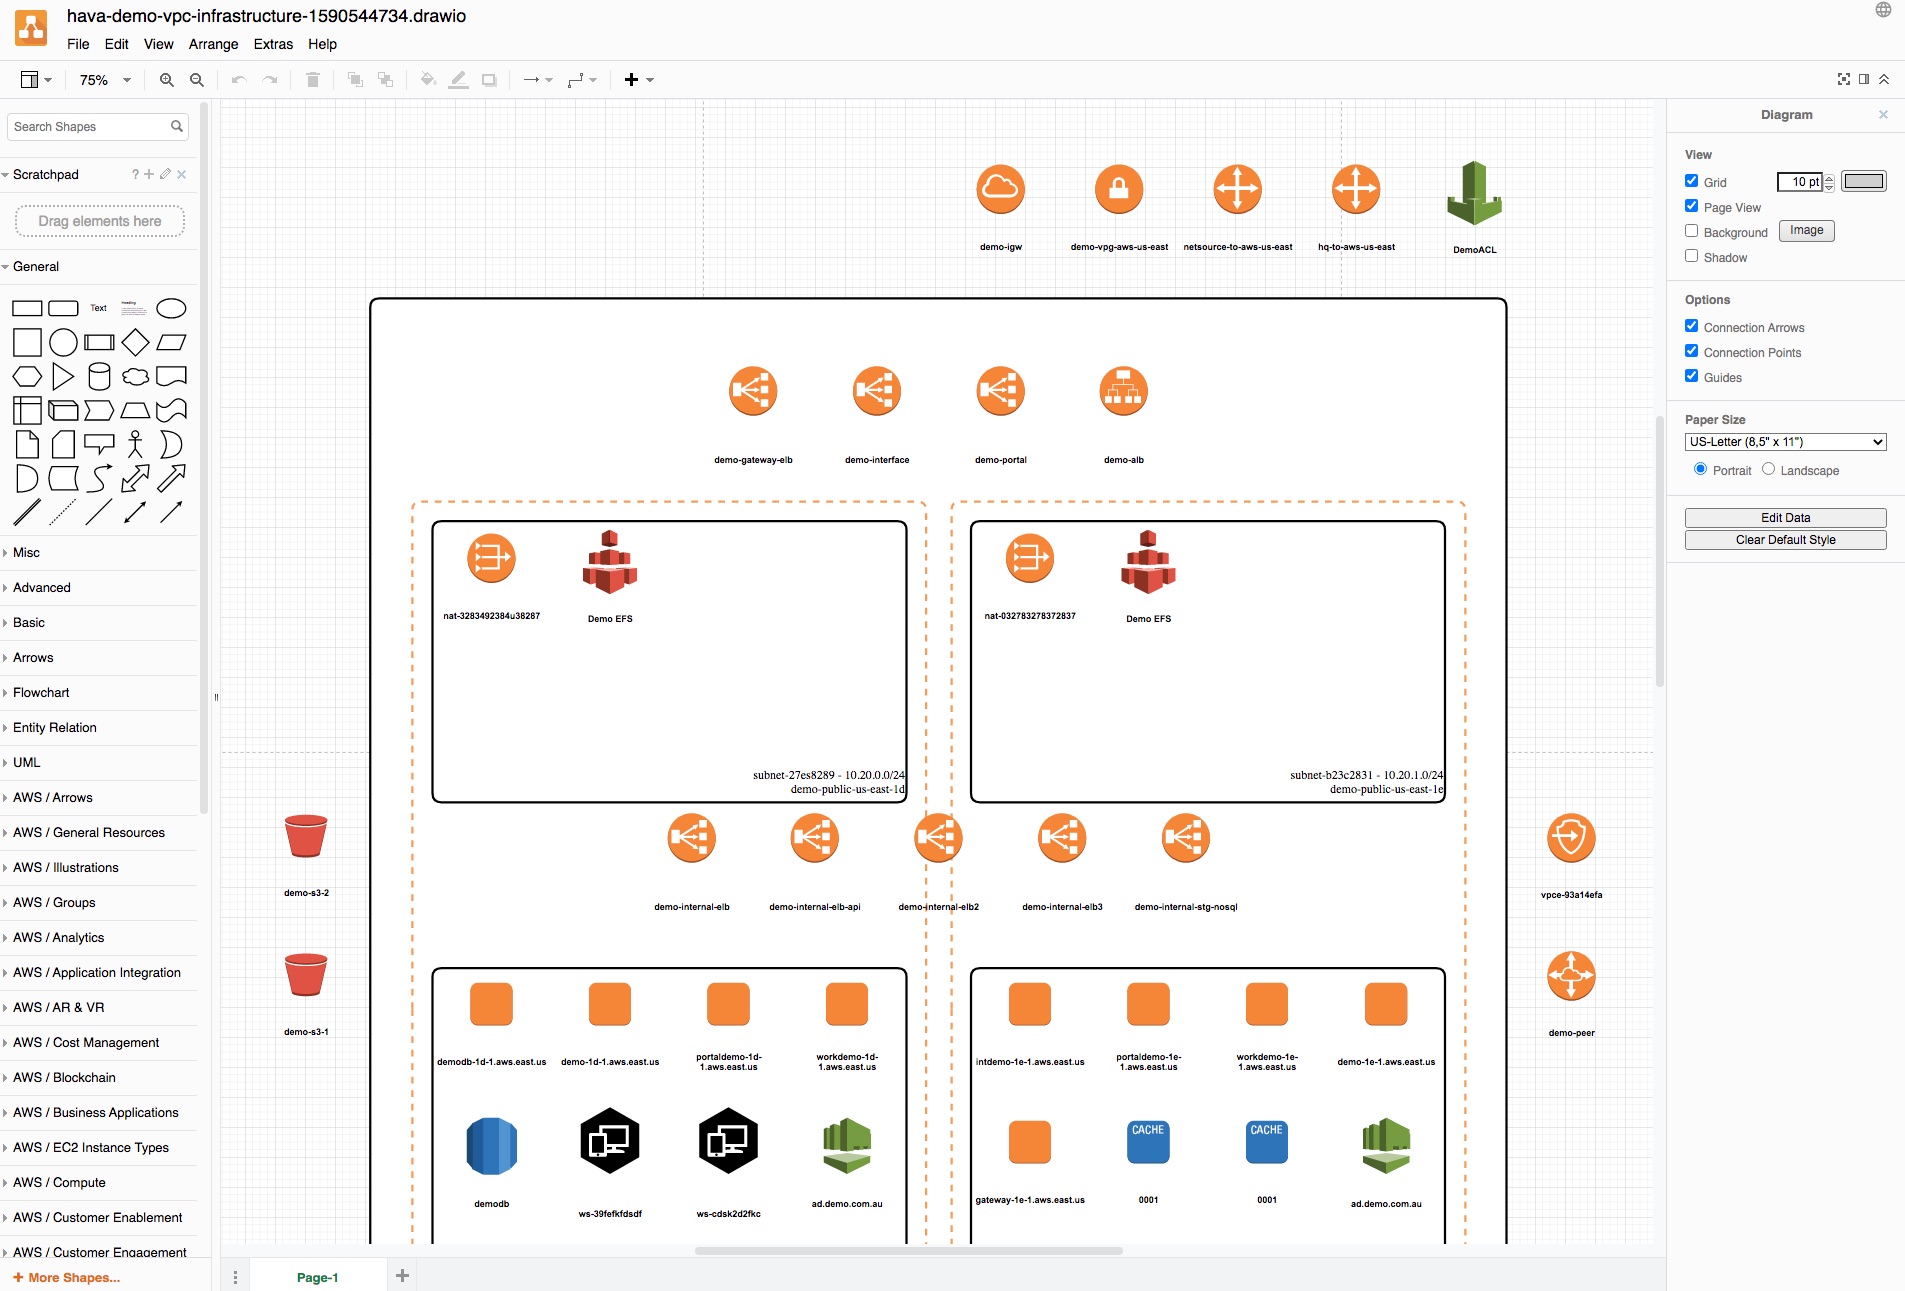
The solution is to visualise your infrastructure using a hands free visualisation tool like Hava. Connecting Hava to your AWS, GCP or Azure account auto generates accurate diagrams so you can then go to work identifying whether the resources detected and drawn are as you expected.
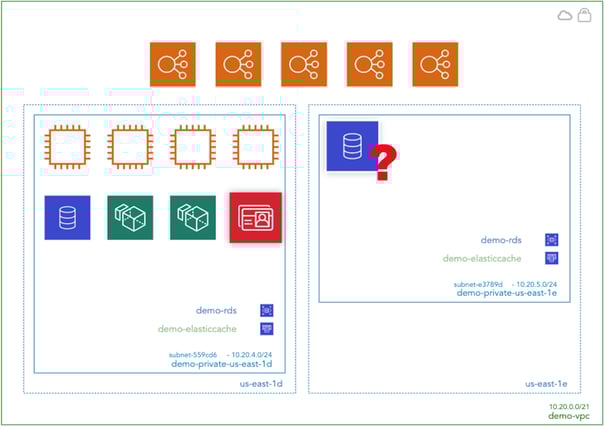
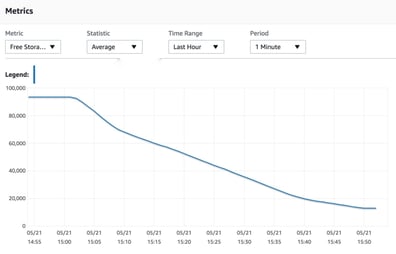
Any anomalies can then be investigated. Take for instance the Hava client that noticed an anomaly in their AWS documentation. After auto generating their diagrams, the client noticed a VPC that contained a large RDS database instance. It was unrelated to their production infrastructure but was costing close to $2k per month. None of the current DevOps team knew anything about it. It turned out to be related to an old test environment that predated the current team. The database hadn't been touched for several years and we estimate that obsolete resource alone had cost the client close to six figures.
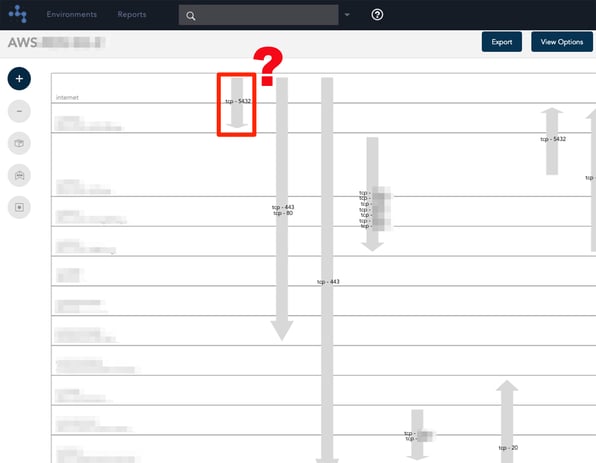
A quick scan of the unique hava.io security view created for your AWS accounts will also give you a good indication of open ports, all your security groups and the points of ingress and egress of your cloud infrastructure traffic. Your security team should be able to immediately spot any vulnerabilities such as ports left open for development purposes that should really be locked down by now.
It is of course possible to sit down with your console and trawl through the thousands of configurations and security settings to manually document your entire active cloud configuration to see what is actually running. You can write down all the resources and their attributes, map out the connections and security. Depending on the size of your infrastructure, it should take more than a couple of weeks.
Alternatively you could connect hava.io to your cloud account(s) and within minutes, have an accurate visual representation of exactly what is running in a logically laid out easy to read format using Hava's new automated cloud diagram UI.
Where most documentation strategies fall down is keeping documentation up to date. It's all very well taking a snapshot and creating a diagram, but knowing what your network topology looked like last week or last month is no indication of what is running today. However knowing what was running last week is still vitally important because if your applications suddenly start experiencing performance issues or are the subject of a catastrophic failure, being able to pull up a diagram of what is running today vs what was running yesterday, or last week, or the day before errors started appearing in your logs is extremely beneficial in finding and fixing the fault.
Automation provides the solution to not only identifying rogue resources and security anomalies, but also providing the mechanism to detect configuration changes and updating documentation as needed. Hava not only solves your documentation accuracy challenges, it also keeps track of changes in your cloud configs, spawns new versions of your infrastructure diagrams and archives the previous version, hands-free automatically. You can then access archived diagrams whenever you like. Not only are the archived diagrams available to view, they are fully interactive, meaning you can click on resources, view all of the attributes and settings for the resource, view security, view open ports and even container status to enable you to compare that point in time to what is running today.
Whether it's a SaaS connection to Hava or a fully self hosted solution, deploying Hava will enable your team to ensure that your AWS, Azure or GCP cloud architecture reality reflects your expectations.

You can take Hava for a free 14 day trial by clicking on the button below, or you can arrange a one on one demo or discuss a self hosted solution by Contacting Us Here

(No Credit Card Required)